Mapping acute systemic effects of inhaled particulate matter and ozone: multiorgan gene expression and glucocorticoid activity
- PMID: 23805001
- PMCID: PMC3748763
- DOI: 10.1093/toxsci/kft137
Mapping acute systemic effects of inhaled particulate matter and ozone: multiorgan gene expression and glucocorticoid activity
Abstract
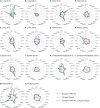
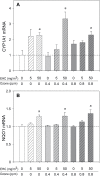
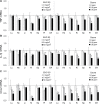
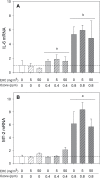
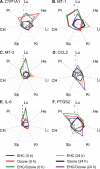
Recent epidemiological studies have demonstrated associations between air pollution and adverse effects that extend beyond respiratory and cardiovascular disease, including low birth weight, appendicitis, stroke, and neurological/neurobehavioural outcomes (e.g., neurodegenerative disease, cognitive decline, depression, and suicide). To gain insight into mechanisms underlying such effects, we mapped gene profiles in the lungs, heart, liver, kidney, spleen, cerebral hemisphere, and pituitary of male Fischer-344 rats immediately and 24h after a 4-h exposure by inhalation to particulate matter (0, 5, and 50mg/m(3) EHC-93 urban particles) and ozone (0, 0.4, and 0.8 ppm). Pollutant exposure provoked differential expression of genes involved in a number of pathways, including antioxidant response, xenobiotic metabolism, inflammatory signalling, and endothelial dysfunction. The mRNA profiles, while exhibiting some interorgan and pollutant-specific differences, were remarkably similar across organs for a set of genes, including increased expression of redox/glucocorticoid-sensitive genes and decreased expression of inflammatory genes, suggesting a possible hormonal effect. Pollutant exposure increased plasma levels of adrenocorticotropic hormone and the glucocorticoid corticosterone, confirming activation of the hypothalamic-pituitary-adrenal axis, and there was a corresponding increase in markers of glucocorticoid activity. Although effects were transient and presumably represent an adaptive response to acute exposure in these healthy animals, chronic activation and inappropriate regulation of the hypothalamic-pituitary-adrenal axis are associated with adverse neurobehavioral, metabolic, immune, developmental, and cardiovascular effects. The experimental data are consistent with epidemiological associations of air pollutants with extrapulmonary health outcomes and suggest a mechanism through which such health effects may be induced.
Keywords: air pollution; glucocorticoid; hypothalamic-pituitary-adrenal axis; ozone; particulate matter; real-time PCR.; systemic effects.
Figures


Similar articles
-
Ozone Inhalation Provokes Glucocorticoid-Dependent and -Independent Effects on Inflammatory and Metabolic Pathways.Toxicol Sci. 2016 Jul;152(1):17-28. doi: 10.1093/toxsci/kfw061. Epub 2016 Apr 1. Toxicol Sci. 2016. PMID: 27037194 Free PMC article.
-
Stress hormones as potential mediators of air pollutant effects on the brain: Rapid induction of glucocorticoid-responsive genes.Environ Res. 2019 Nov;178:108717. doi: 10.1016/j.envres.2019.108717. Epub 2019 Sep 4. Environ Res. 2019. PMID: 31520820
-
Ozone modifies the metabolic and endocrine response to glucose: Reproduction of effects with the stress hormone corticosterone.Toxicol Appl Pharmacol. 2018 Mar 1;342:31-38. doi: 10.1016/j.taap.2018.01.020. Epub 2018 Jan 31. Toxicol Appl Pharmacol. 2018. PMID: 29391239
-
Stretching the stress boundary: Linking air pollution health effects to a neurohormonal stress response.Biochim Biophys Acta. 2016 Dec;1860(12):2880-90. doi: 10.1016/j.bbagen.2016.05.010. Epub 2016 May 8. Biochim Biophys Acta. 2016. PMID: 27166979 Review.
-
Neuroendocrine Regulation of Air Pollution Health Effects: Emerging Insights.Toxicol Sci. 2018 Jul 1;164(1):9-20. doi: 10.1093/toxsci/kfy129. Toxicol Sci. 2018. PMID: 29846720 Free PMC article. Review.
Cited by
-
Plasma sterols and vitamin D are correlates and predictors of ozone-induced inflammation in the lung: A pilot study.PLoS One. 2023 May 15;18(5):e0285721. doi: 10.1371/journal.pone.0285721. eCollection 2023. PLoS One. 2023. PMID: 37186612 Free PMC article.
-
Associations between air pollution and perceived stress: the Veterans Administration Normative Aging Study.Environ Health. 2015 Jan 27;14:10. doi: 10.1186/1476-069X-14-10. Environ Health. 2015. PMID: 25627872 Free PMC article.
-
Modulation by Ozone of Glucocorticoid-Regulating Factors in the Lungs in Relation to Stress Axis Reactivity.Toxics. 2021 Nov 3;9(11):290. doi: 10.3390/toxics9110290. Toxics. 2021. PMID: 34822681 Free PMC article.
-
Exposure to air pollutants and the gut microbiota: a potential link between exposure, obesity, and type 2 diabetes.Gut Microbes. 2020 Sep 2;11(5):1188-1202. doi: 10.1080/19490976.2020.1749754. Epub 2020 Apr 29. Gut Microbes. 2020. PMID: 32347153 Free PMC article. Review.
-
Does air pollution trigger suicide? A case-crossover analysis of suicide deaths over the life span.Eur J Epidemiol. 2017 Nov;32(11):973-981. doi: 10.1007/s10654-017-0273-8. Epub 2017 Jun 16. Eur J Epidemiol. 2017. PMID: 28623424
References
-
- Anagnostis P., Athyros V. G., Tziomalos K., Karagiannis A., Mikhailidis D. P. (2009). Clinical review: The pathogenetic role of cortisol in the metabolic syndrome: A hypothesis. J. Clin. Endocrinol. Metab. 94, 2692–2701. - PubMed
-
- Andersen C. L., Jensen J. L., Ørntoft T. F. (2004). Normalization of real-time quantitative reverse transcription-PCR data: A model-based variance estimation approach to identify genes suited for normalization, applied to bladder and colon cancer data sets. Cancer Res. 64, 5245–5250. - PubMed
-
- Ayroldi E., Riccardi C. (2009). Glucocorticoid-induced leucine zipper (GILZ): A new important mediator of glucocorticoid action. FASEB J. 23, 3649–3658. - PubMed
-
- Beishuizen A., Thijs L. G. (2003). Endotoxin and the hypothalamo-pituitary-adrenal (HPA) axis. J. Endotoxin Res. 9, 3–24. - PubMed
Publication types
MeSH terms
Substances
LinkOut - more resources
Full Text Sources
Other Literature Sources
Medical

