

Extensive neurological recovery from a complete spinal cord injury: a case report and hypothesis on the role of cortical plasticity
- PMID: 23805087
- PMCID: PMC3691521
- DOI: 10.3389/fnhum.2013.00290
Extensive neurological recovery from a complete spinal cord injury: a case report and hypothesis on the role of cortical plasticity
Abstract
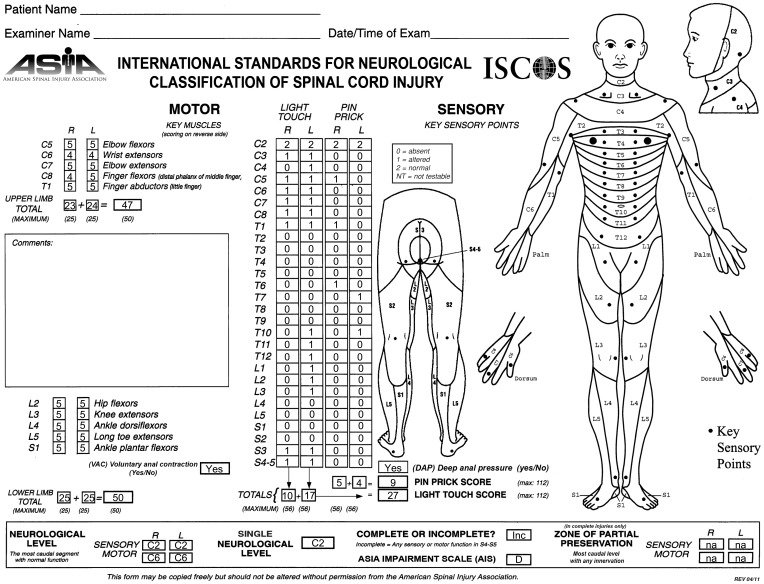
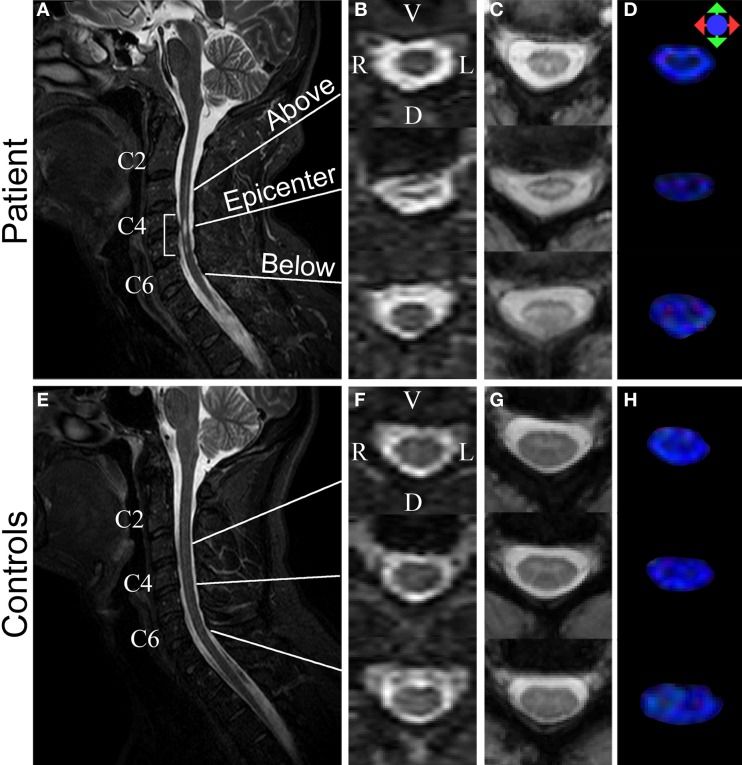
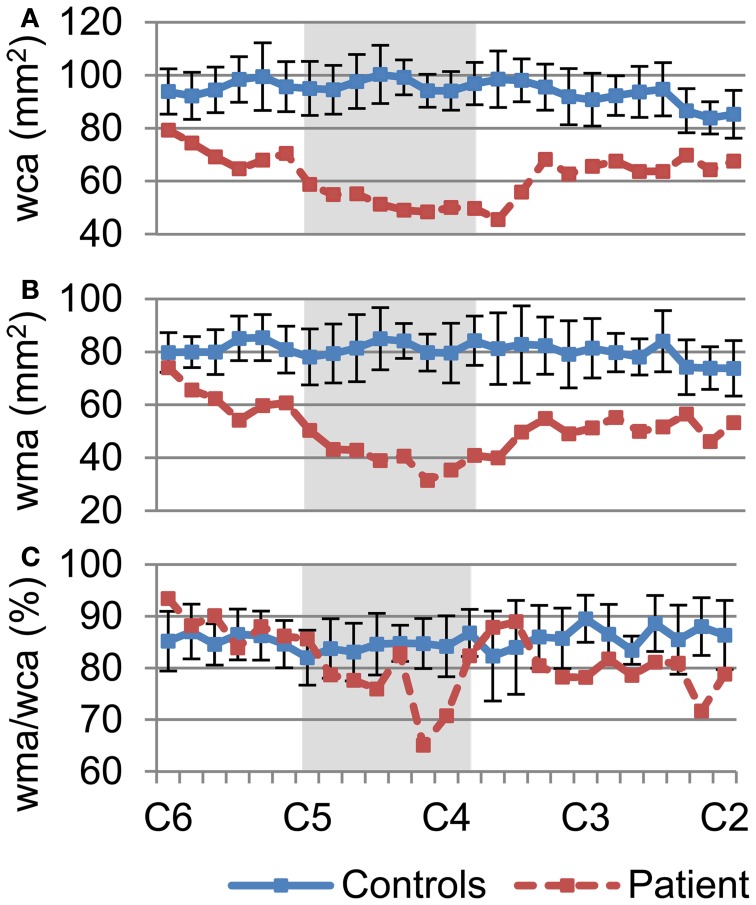
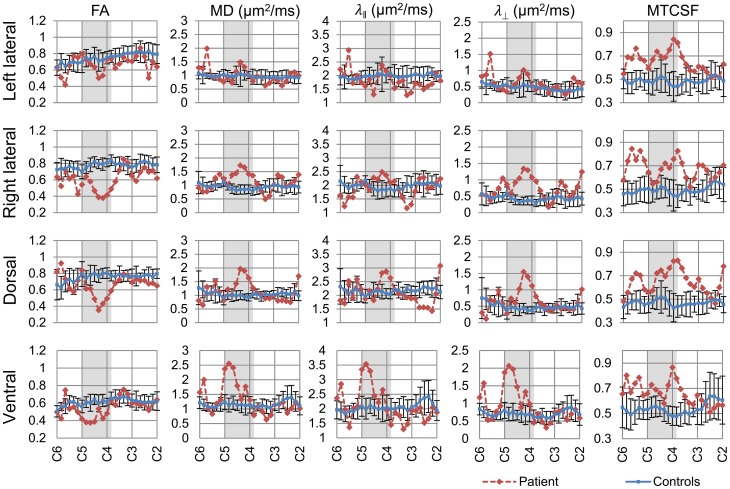
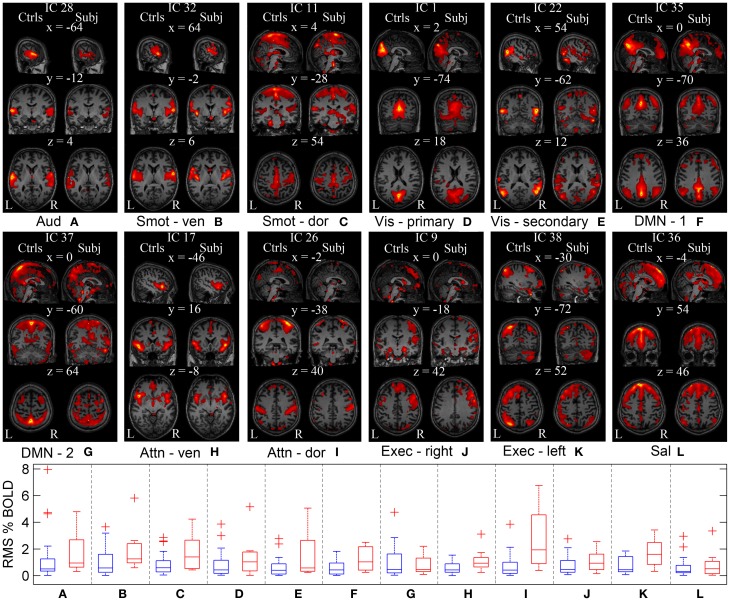
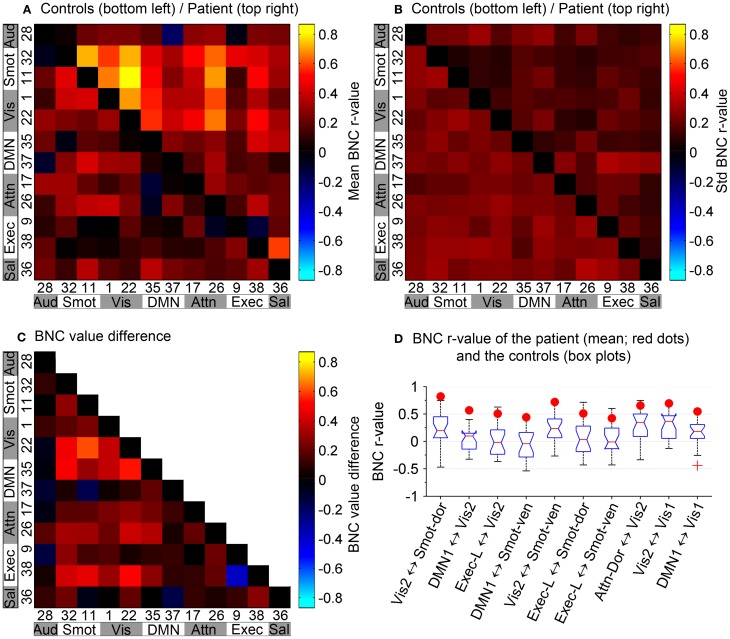
Neurological recovery in patients with severe spinal cord injury (SCI) is extremely rare. We have identified a patient with chronic cervical traumatic SCI, who suffered a complete loss of motor and sensory function below the injury for 6 weeks after the injury, but experienced a progressive neurological recovery that continued for 17 years. The extent of the patient's recovery from the severe trauma-induced paralysis is rare and remarkable. A detailed study of this patient using diffusion tensor imaging (DTI), magnetization transfer imaging (MTI), and resting state fMRI (rs-fMRI) revealed structural and functional changes in the central nervous system that may be associated with the neurological recovery. Sixty-two percent cervical cord white matter atrophy was observed. DTI-derived quantities, more sensitive to axons, demonstrated focal changes, while MTI-derived quantity, more sensitive to myelin, showed a diffuse change. No significant cortical structural changes were observed, while rs-fMRI revealed increased brain functional connectivity between sensorimotor and visual networks. The study provides comprehensive description of the structural and functional changes in the patient using advanced MR imaging technique. This multimodal MR imaging study also shows the potential of rs-fMRI to measure the extent of cortical plasticity.
Keywords: diffusion tensor imaging; magnetization transfer imaging; plasticity; resting state fMRI; spinal cord injury; trauma.
Figures
Similar articles
-
Motor recovery at 6 months after admission is related to structural and functional reorganization of the spine and brain in patients with spinal cord injury.Hum Brain Mapp. 2016 Jun;37(6):2195-209. doi: 10.1002/hbm.23163. Epub 2016 Mar 3. Hum Brain Mapp. 2016. PMID: 26936834 Free PMC article.
-
Alterations in Cortical Sensorimotor Connectivity following Complete Cervical Spinal Cord Injury: A Prospective Resting-State fMRI Study.PLoS One. 2016 Mar 8;11(3):e0150351. doi: 10.1371/journal.pone.0150351. eCollection 2016. PLoS One. 2016. PMID: 26954693 Free PMC article. Clinical Trial.
-
Sensorimotor cortical plasticity during recovery following spinal cord injury: a longitudinal fMRI study.Neurorehabil Neural Repair. 2007 Nov-Dec;21(6):527-38. doi: 10.1177/1545968307301872. Epub 2007 May 16. Neurorehabil Neural Repair. 2007. PMID: 17507643
-
The role of diffusion tensor imaging in the diagnosis, prognosis, and assessment of recovery and treatment of spinal cord injury: a systematic review.Neurosurg Focus. 2019 Mar 1;46(3):E7. doi: 10.3171/2019.1.FOCUS18591. Neurosurg Focus. 2019. PMID: 30835681
-
[Review of the regeneration mechanism of complete spinal cord injury].Zhongguo Xiu Fu Chong Jian Wai Ke Za Zhi. 2018 Jun 15;32(6):641-649. doi: 10.7507/1002-1892.201805069. Zhongguo Xiu Fu Chong Jian Wai Ke Za Zhi. 2018. PMID: 29905039 Free PMC article. Review. Chinese.
Cited by
-
Inconsistency between cortical reorganization and functional connectivity alteration in the sensorimotor cortex following incomplete cervical spinal cord injury.Brain Imaging Behav. 2020 Dec;14(6):2367-2377. doi: 10.1007/s11682-019-00190-9. Brain Imaging Behav. 2020. PMID: 31444779
-
Cortical Reorganization of Sensorimotor Systems and the Role of Intracortical Circuits After Spinal Cord Injury.Neurotherapeutics. 2018 Jul;15(3):588-603. doi: 10.1007/s13311-018-0638-z. Neurotherapeutics. 2018. PMID: 29882081 Free PMC article. Review.
-
Motor recovery at 6 months after admission is related to structural and functional reorganization of the spine and brain in patients with spinal cord injury.Hum Brain Mapp. 2016 Jun;37(6):2195-209. doi: 10.1002/hbm.23163. Epub 2016 Mar 3. Hum Brain Mapp. 2016. PMID: 26936834 Free PMC article.
-
A shift of brain network hub after spinal cord injury.Front Mol Neurosci. 2023 Oct 17;16:1245902. doi: 10.3389/fnmol.2023.1245902. eCollection 2023. Front Mol Neurosci. 2023. PMID: 37915973 Free PMC article.
-
White matter changes in corticospinal tract associated with improvement in arm and hand functions in incomplete cervical spinal cord injury: pilot case series.Spinal Cord Ser Cases. 2017 Jun 15;3:17028. doi: 10.1038/scsandc.2017.28. eCollection 2017. Spinal Cord Ser Cases. 2017. PMID: 28944083 Free PMC article.
References
-
- Beg M., Miller M., Trouve A., Younes L. (2005). Computing large deformation metric mappings via goodesic flows of diffeomorphisms. Int. J. Comput. Vis. 61, 139–157 10.1023/B:VISI.0000043755.93987.aa - DOI
Publication types
Grants and funding
LinkOut - more resources
Full Text Sources
Other Literature Sources
Medical