. 2013 Jun 26:4:223.
doi: 10.3389/fpls.2013.00223. eCollection 2013.

Are sucrose transporter expression profiles linked with patterns of biomass partitioning in Sorghum phenotypes?

Affiliations

Are sucrose transporter expression profiles linked with patterns of biomass partitioning in Sorghum phenotypes?

Ricky J Milne et al. Front Plant Sci. .

Abstract

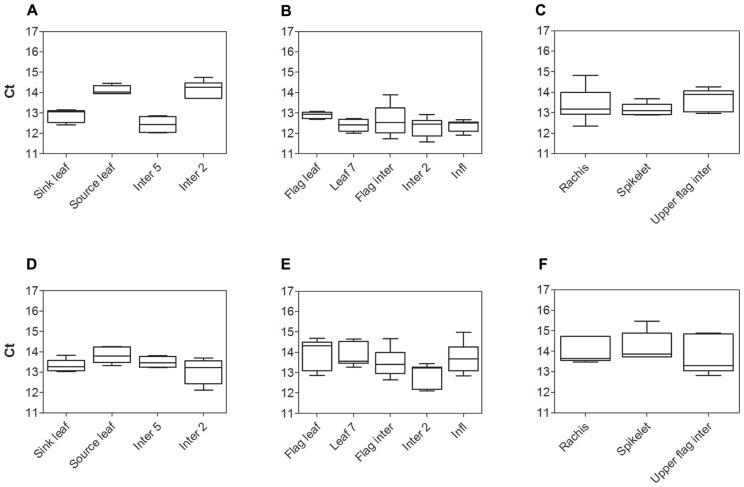
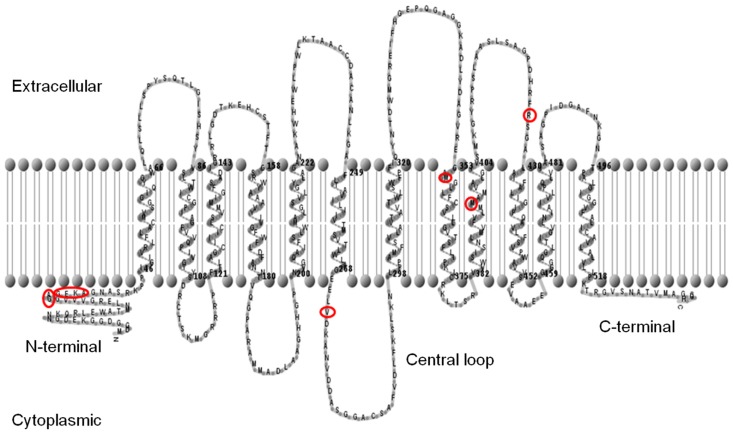
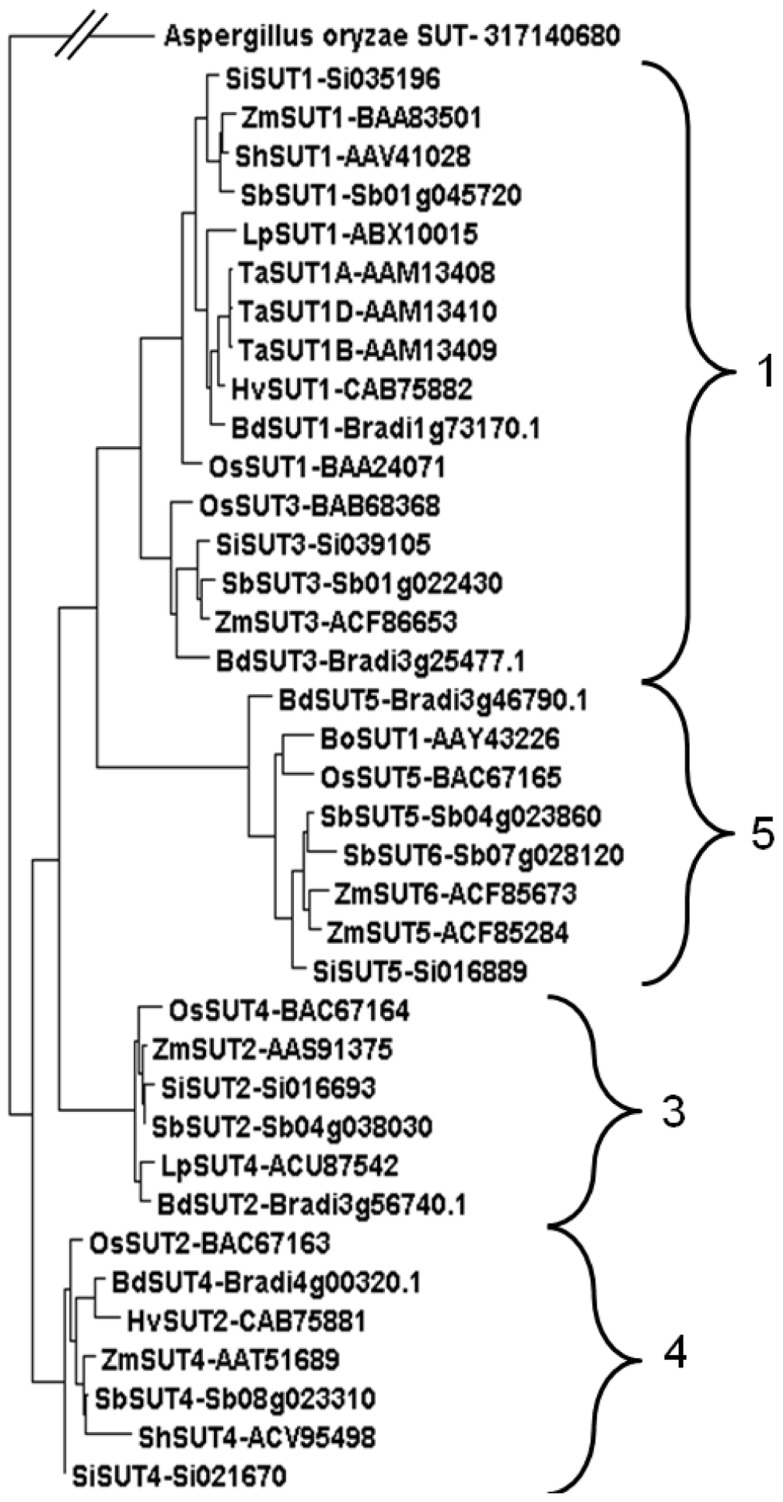
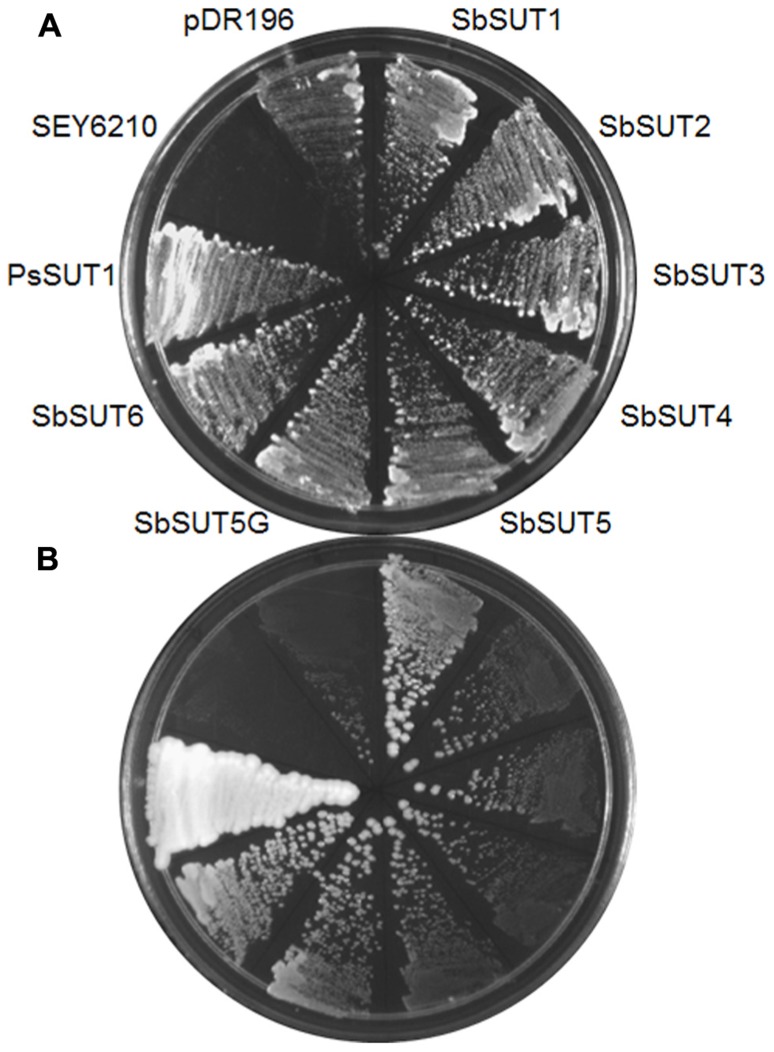
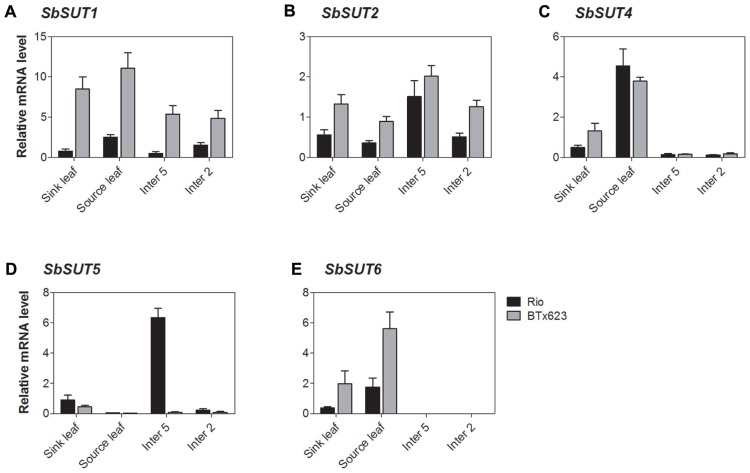
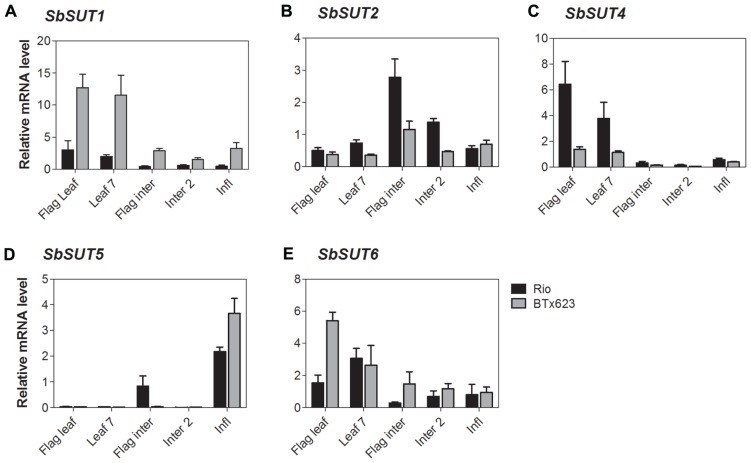
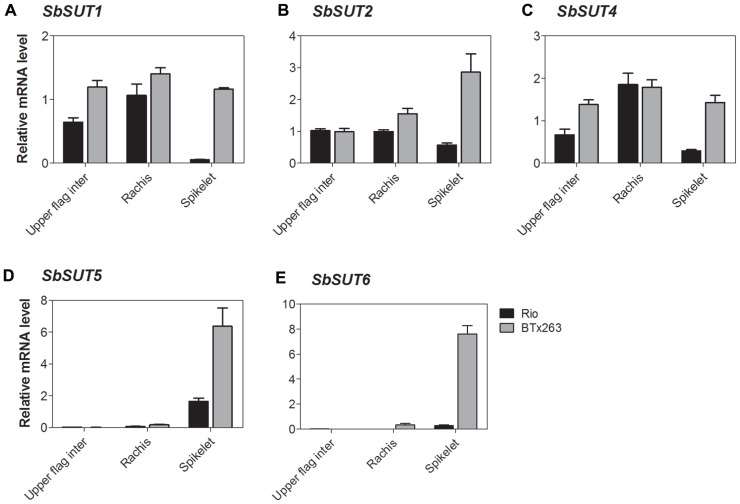
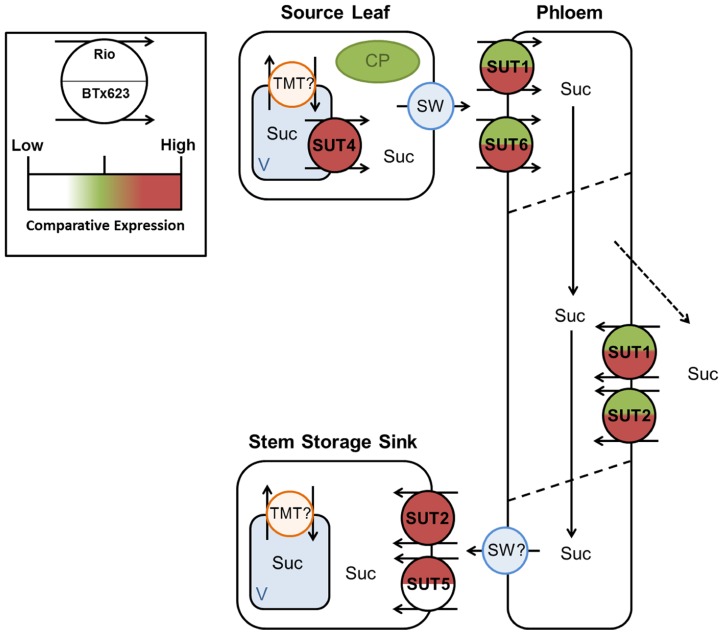
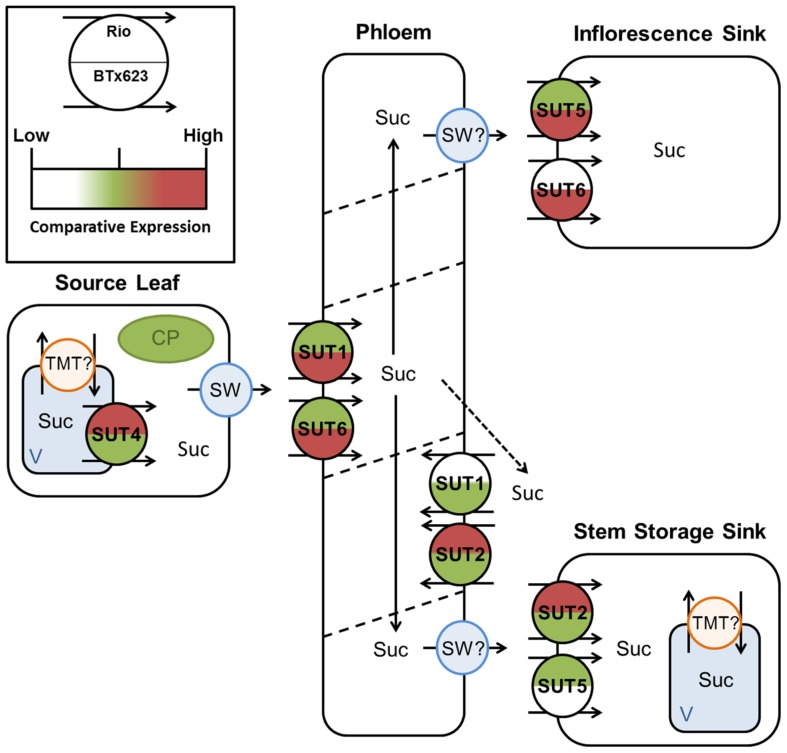
Sorghum bicolor is a genetically diverse C4 monocotyledonous species, encompassing varieties capable of producing high grain yields as well as sweet types which accumulate soluble sugars (predominantly sucrose) within their stems to high concentrations. Sucrose produced in leaves (sources) enters the phloem and is transported to regions of growth and storage (sinks). It is likely that sucrose transporter (SUT) proteins play pivotal roles in phloem loading and the delivery of sucrose to growth and storage sinks in all Sorghum ecotypes. Six SUTs are present in the published Sorghum genome, based on the BTx623 grain cultivar. Homologues of these SUTs were cloned and sequenced from the sweet cultivar Rio, and compared with the publically available genome information. SbSUT5 possessed nine amino acid sequence differences between the two varieties. Two of the remaining five SUTs exhibited single variations in their amino acid sequences (SbSUT1 and SbSUT2) whilst the rest shared identical sequences. Complementation of a mutant Saccharomyces yeast strain (SEY6210), unable to grow upon sucrose as the sole carbon source, demonstrated that the Sorghum SUTs were capable of transporting sucrose. SbSUT1, SbSUT4, and SbSUT6 were highly expressed in mature leaf tissues and hence may contribute to phloem loading. In contrast, SbSUT2 and SbSUT5 were expressed most strongly in sinks consistent with a possible role of facilitating sucrose import into stem storage pools and developing inflorescences.

Keywords: Sorghum; expression profiling; source–sink pathway; sucrose storage; sucrose transporters.


Figures

FIGURE 1
FIGURE 1
Analysis of Sorghum housekeeping gene SbEF-1α expression, by qPCR. Cycle threshold (Ct) values for the Sorghum SbEF-1α gene in cv. Rio (A–C) and cv. BTx623 (D–F) during vegetative growth (A,D), at anthesis (B, E), and within the upper flag internode and inflorescence components at anthesis (C, F). Box and whisker plots represent minimum to maximum Ct value, with upper and lower quartile from five biological replicates.
FIGURE 2
FIGURE 2
Predicted membrane topology of the SbSUT5 protein. The predicted trans-membrane regions of the SbSUT5 transporter from sweet Sorghum (Rio), identifying which amino acids differ between cv. Rio and cv. BTx623 (red circles). Twelve trans-membrane domains are predicted. The membrane topology was generated using the TMHMM server v 2.0 (http://www.cbs.dtu.dk/services/TMHMM/) and TMRPpres2D viewer (Spyropoulos et al.,2004).
FIGURE 3
FIGURE 3
Phylogenetic analysis of SUTs from monocotyledonous species. SUTs displayed fit into Groups 1, 3, 4, 5 (Braun and Slewinski, 2009) from species Brachypodium distachyon* (BdSUT1, BdSUT2, BdSUT3, BdSUT4, BdSUT5), Bambusa oldhamii (BoSUT1), Hordeum vulgare (HvSUT1, HvSUT2), Lolium perenne (LpSUT1, LpSUT4), Oryza sativa* (OsSUT1, OsSUT2, OsSUT3, OsSUT4, OsSUT5), Saccharum hybrid (ShSUT1, ShSUT4), Setaria italica* (SiSUT1, SiSUT2, SiSUT3, SiSUT4, SiSUT5), Sorghum bicolor* (SbSUT1 – Sb01g045720, SbSUT2 – Sb04g038030, SbSUT3 – Sb01g022430, SbSUT4 – Sb08g023310, SbSUT5 – Sb04g023860, SbSUT6 – Sb07g028120), Triticum aestivum (TaSUT1A, TaSUT1B, TaSUT1D), Zea mays* (ZmSUT1, ZmSUT2, ZmSUT3, ZmSUT4, ZmSUT5, ZmSUT6). Phylogenetic analysis was carried out using MUSCLE alignment, Gblocks curation followed by PhyML phylogeny (Dereeper et al., 2008) before viewing in Dendroscope (Huson et al., 2007). Accession numbers are shown along with gene identifications (Brachypodium, Setaria, and Sorghum). Asterisks indicate that the full genomic sequence is publicly available.
FIGURE 4
FIGURE 4
Complementation of the SEY6210 yeast strain by Sorghum SUTs. All Sorghum SUTs were expressed in the yeast strain SEY6210 and grown on media containing (A) 100 mM glucose or (B) 25 mM sucrose as the sole carbon source. SuSy7 containing PsSUT1 was used as a positive control. The SuSy7 PsSUT1-pDR195 (Zhou et al., 2007) was used as a positive control and negative controls were untransformed SEY6210 and pDR196 empty vector.
FIGURE 5
FIGURE 5
Sorghum SUT transcript levels during vegetative growth. Relative expression during vegetative growth of Sorghum SUTs. (A) SbSUT1; (B) SbSUT2; (C) SbSUT4; (D) SbSUT5; (E) SbSUT6. Levels of SUT expression were measured relative to SbEF-1α. Organs examined were a Sink leaf (expanding); Source leaf (youngest fully expanded); Internode 5 (Inter 5, elongating); and Internode 2 (Inter 2, fully elongated). Columns with vertical bars represent mean ± SE from five biological replicates.
FIGURE 6
FIGURE 6
Sorghum SUT transcript levels at anthesis.Relative expression at anthesis of Sorghum SUTs (A) SbSUT1; (B) SbSUT2; (C) SbSUT4; (D) SbSUT5; (E) SbSUT6. Levels of SUT expression were measured relative to SbEF-1α. Organs examined were the Flag leaf; Leaf 7; flag internode (Flag inter); Internode 2 (Inter 2) and the inflorescence (Infl). Columns with vertical bars represent mean ± SE from five biological replicates.
FIGURE 7
FIGURE 7
Sorghum SUT transcript levels at anthesis in the upper portion of the flag internode and within the inflorescence. Relative expression at anthesis of the Sorghum SUTs (A) SbSUT1; (B) SbSUT2; (C) SbSUT4; (D) SbSUT5; (E) SbSUT6. Levels of SUT expression were measured relative to SbEF-1α. Organs examined were the Rachis and Spikelet as well as the upper portion of the flag internode (Upper flag inter). Columns with vertical bars represent mean ± SE from five biological replicates.
FIGURE 8
FIGURE 8
Predicted source–transport–sink pathway in Sorghum during vegetative growth. Sucrose is released from source vacuoles (V) by SbSUT4. SbSUT1 and SbSUT6 load the phloem. SbSUT1 and SbSUT2 may act to retrieve sucrose leaked from the transport phloem. SbSUT2 and SbSUT5 load sucrose into stem sinks. SWEETs (SW) efflux sucrose to the apoplasm and tonoplast monosaccharide transporters (TMT) move sucrose into vacuoles. Comparison of relative expression of each SUT is color coded.
FIGURE 9
FIGURE 9
Predicted source–transport–sink pathway in Sorghum at anthesis.Sucrose is released from source vacuoles (V) by SbSUT4. SbSUT1 and SbSUT6 load the phloem. SbSUT1 and SbSUT2 may act to retrieve sucrose leaked from the transport phloem. SbSUT2 and SbSUT5 load sucrose into stem sinks. SbSUT5 and SbSUT6 load sucrose into reproductive sinks. SWEETs (SW) efflux sucrose to the apoplasm and tonoplast monosaccharide transporters (TMT) move sucrose into vacuoles. Comparison of relative expression of each SUT is color coded.

References

    1. Aoki N., Hirose T., Scofield G. N., Whitfeld P. R., Furbank R. T. (2003) The sucrose transporter gene family in rice. Plant Cell Physiol. 44 223–232 10.1093/pcp/pcg030 - DOI - PubMed
    1. Aoki N., Whitfield P., Hoeren F., Scofield G., Newell K., Patrick J., et al. (2002) Three sucrose transporter genes are expressed in the developing grain of hexaploid wheat. Plant Mol. Biol. 50 453–462 10.1023/A:1019846832163 - DOI - PubMed
    1. Barth I., Meyer S., Sauer N. (2003) PmSUC3: characterization of a SUT2/SUC3-type sucrose transporter from Plantago major. Plant Cell 15 1375–1385 10.1105/tpc.010967 - DOI - PMC - PubMed
    1. Berthier A., Desclos M., Amiard V., Morvan-Bertrand A., Demmig-Adams B., Adams W. W., et al. (2009) Activation of sucrose transport in defoliated Lolium perenneL.:an example of apoplastic phloem loading plasticity. Plant Cell Physiol. 50 1329–1344 10.1093/pcp/pcp081 - DOI - PubMed
    1. Blum A., Sinmena B., Mayer J., Golan G., Shpiler L. (1994) Stem reserve mobilization supports wheat-grain filling under heat-stress. Aust. J. Plant Physiol. 21 771–781 10.1071/PP9940771 - DOI

LinkOut - more resources