. 2013 Jun 21;8(6):e65490.
doi: 10.1371/journal.pone.0065490. Print 2013.

Aberrant Pregnancy Adaptations in the Peripheral Immune Response in Type 1 Diabetes: A Rat Model

Affiliations

Aberrant Pregnancy Adaptations in the Peripheral Immune Response in Type 1 Diabetes: A Rat Model

Bart Groen et al. PLoS One. .

Abstract

Introduction: Despite tight glycemic control, pregnancy complication rate in type 1 diabetes patients is higher than in normal pregnancy. Other etiological factors may be responsible for the development of adverse pregnancy outcome. Acceptance of the semi-allogeneic fetus is accompanied by adaptations in the maternal immune-response. Maladaptations of the immune-response has been shown to contribute to pregnancy complications. We hypothesized that type 1 diabetes, as an autoimmune disease, may be associated with maladaptations of the immune-response to pregnancy, possibly resulting in pregnancy complications.

Methods: We studied pregnancy outcome and pregnancy-induced immunological adaptations in a normoglycemic rat-model of type 1 diabetes, i.e. biobreeding diabetes-prone rats (BBDP; 5 non-pregnant rats, 7 pregnant day 10 rats and 6 pregnant day 18 rats) , versus non-diabetic control rats (i.e. congenic non-diabetic biobreeding diabetes-resistant (BBDR; 6 non-pregnant rats, 6 pregnant day 10 rats and 6 pregnant day 18 rats) and Wistar-rats (6 non-pregnant, 6 pregnant day 10 rats and 5 pregnant day 18 rats)).

Results: We observed reduced litter size, lower fetal weight of viable fetuses and increased numbers of resorptions versus control rats. These complications are accompanied by various differences in the immune-response between BBDP and control rats in both pregnant and non-pregnant animals. The immune-response in non-pregnant BBDP-rats was characterized by decreased percentages of lymphocytes, increased percentages of effector T-cells, regulatory T-cells and natural killer cells, an increased Th1/Th2-ratio and activated monocytes versus Wistar and BBDR-rats. Furthermore, pregnancy-induced adaptations in BBDP-rats coincided with an increased Th1/Th2-ratio, a decreased mean fluorescence intensity CD161a/NKR-P1b ratio and no further activation of monocytes versus non-diabetic control rats.

Conclusion: This study suggests that even in the face of strict normoglycemia, pregnancy complications still occur in type 1 diabetic pregnancies. This adverse pregnancy outcome may be related to the aberrant immunological adaptations to pregnancy in diabetic rats.


Conflict of interest statement

Competing Interests: The authors have declared that no competing interests exist.

Figures

Figure 1
Figure 1. Flowchart of the experimental design.
Figure 2
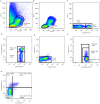
Figure 2. An representative example of a FACS analysis procedure to evaluate lymphocytes subpopulations.
[A] A forward/sideward (FSC/SSC) scatterplot of all events in which leukocytes were identified. [B] The leukocyte gate was copied to a FSC/SSC scatterplot in which the lymphocytes are identified. [C] These lymphocytes are copied to a SSC/CD3-PerCP scatterplot to distinguish T-lymphocytes (CD3+). [D] The lymphocytes are further divided into helper (CD3+/CD4+) and cytotoxic (CD3+/CD4+; ct) T-cells in a CD3 PerCP/CD4 Alexa 700 scatterplot. [E] A CD3 PerCP/CD25 FITC scatterplot in which CD3 cells were copied to assess the gate for FITC-positivity. [F] This gate for FITC positivity was copied to a CD4 Alexa 700/CD25 FITC scatterplot to identify CD25 positive and negative cells; i.e. effector (CD3+/CD4+/CD25+) and naive helper T-cells (CD3+/CD4+/CD25). [G] A CD25 FITC/FoxP3 Alexa 647 scatterplot to identify the regulatory T-cell (CD3+/CD4+/CD25+/FoxP3+; Treg) positive population.
Figure 3
Figure 3. Lymphocyte subpopulations in non-pregnant rats.
[A] The percentages of T-lymphocytes (of the total leukocyte population), the ratio of T-helper cells (Th) and cytotoxic T-cells (Tc), percentages effector T-cells (of Th; Teff), regulatory T-cells (of Th; Treg), NK-cells (of total lymphocyte population) and the ratio of MFI CD161a/NKR-P1b of NK-cells of the three non-pregnant rat-strains. [B] The Th1/Th2-mRNA ratio and mRNA expression of ROR-C of the three non-pregnant rat-strains. Values are expressed as median with range (Q1–Q3), mRNA was expressed as Fold Change (2∧−ΔCT). ‘*’ significant difference, Mann-Whitney U-Test, p<0.05.
Figure 4
Figure 4. Monocyte subpopulations in non-pregnant rats.
The ratio of non-classical/classical monocytes [A], the percentage of CD4+ classical monocytes [B], the MFI of CD4 on classical monocytes [C], the percentage of CD4+ non-classical monocytes [D] and the MFI of CD4 on non-classical monocytes [E] in non-pregnant animals of each strain. Values expressed as median with range (Q1–Q3), ‘*’ significant difference, Mann-Whitney U-Test, p<0.05.
Figure 5
Figure 5. Lymphocyte subpopulations in pregnant rats.
Values of day 10 or 18 of pregnancy are recalculated regarding the median values of non-pregnant animals (which was set at 100%) to express (as median (Q1–Q3)) pregnancy-induced changes. [A] The adaptations to pregnancy in percentage of T-lymphocytes, ratio of T-helper cells (Th) and cytotoxic T-cells (Tc), percentages of effector T-cells (Teff), regulatory T-cells (Treg), NK-cells and the ratio of MFI CD161a/NKR-P1b of NK-cells in all three strains during pregnancy. [B] The adaptations to pregnancy of the Th1/Th2-mRNA ratio and ROR-C mRNA expression in all three strains during pregnancy. d10/d18: day 10 or 18 of pregnancy. ∞slope significantly different from zero (Regression-analysis, ANCOVA, p<0.05). *slope significant different between the marked strains (Regression-analysis, ANCOVA, p<0.05).
Figure 6
Figure 6. Monocyte subpopulations in pregnant rats.
Values of day 10 or 18 of pregnancy are recalculated regarding the median values of non-pregnant animals (which was set at 100%) to express (as median (Q1–Q3)) pregnancy-induced changes. [A] The adaptations to pregnancy in the ratio non-classical/classical monocytes, [B] the percentage of CD4+ classical monocytes, [C] the MFI of CD4 on classical monocytes, [D] the percentage of CD4+ non-classical monocytes and [E] the MFI of CD4 on non-classical monocytes of each strain during pregnancy. d10/d18: day 10 or 18 of pregnancy. ∞slope significantly different from zero (Regression-analysis, ANCOVA, p<0.05). *slope significant different between the marked strains (Regression-analysis, ANCOVA, p<0.05).

References

    1. Evers IM, de Valk HW, Visser GH (2004) Risk of complications of pregnancy in women with type 1 diabetes: Nationwide prospective study in the netherlands. BMJ 328: 915. - PMC - PubMed
    1. Taylor R, Davison JM (2007) Type 1 diabetes and pregnancy. BMJ 334: 742–745. - PMC - PubMed
    1. [Anonymous] (1996) Pregnancy outcomes in the diabetes control and complications trial. Am J Obstet Gynecol 174: 1343–1353. - PubMed
    1. Hawthorne G, Robson S, Ryall EA, Sen D, Roberts SH, et al. (1997) Prospective population based survey of outcome of pregnancy in diabetic women: Results of the northern diabetic pregnancy audit, 1994. BMJ 315: 279–281. - PMC - PubMed
    1. Murphy HR, Rayman G, Lewis K, Kelly S, Johal B, et al. (2008) Effectiveness of continuous glucose monitoring in pregnant women with diabetes: Randomised clinical trial. BMJ 337: a1680. - PMC - PubMed

MeSH terms