. 2013 Jun 21;8(6):e66183.
doi: 10.1371/journal.pone.0066183. Print 2013.

Optimization of Multiple Pathogen Detection Using the TaqMan Array Card: Application for a Population-Based Study of Neonatal Infection

Affiliations

Optimization of Multiple Pathogen Detection Using the TaqMan Array Card: Application for a Population-Based Study of Neonatal Infection

Maureen H Diaz et al. PLoS One. .

Abstract

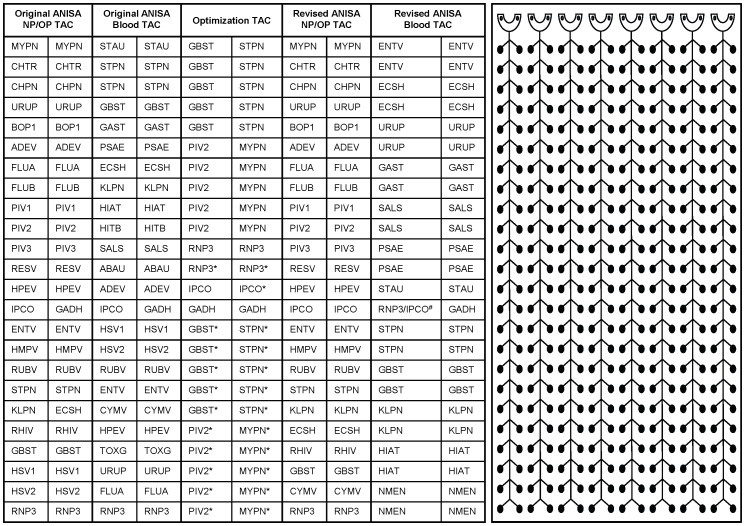
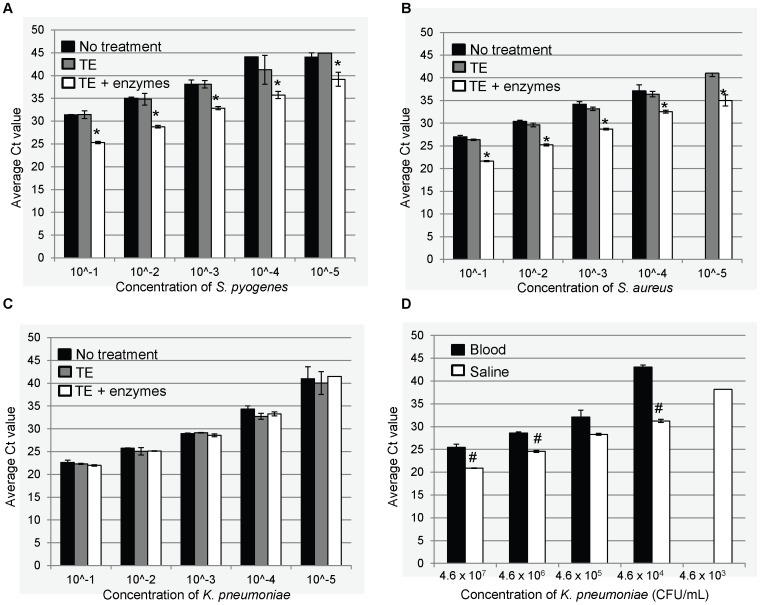
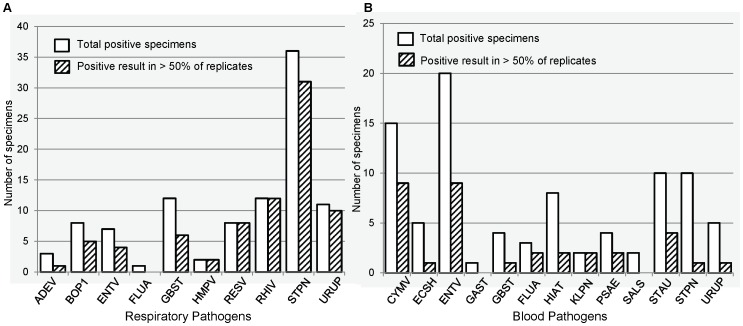
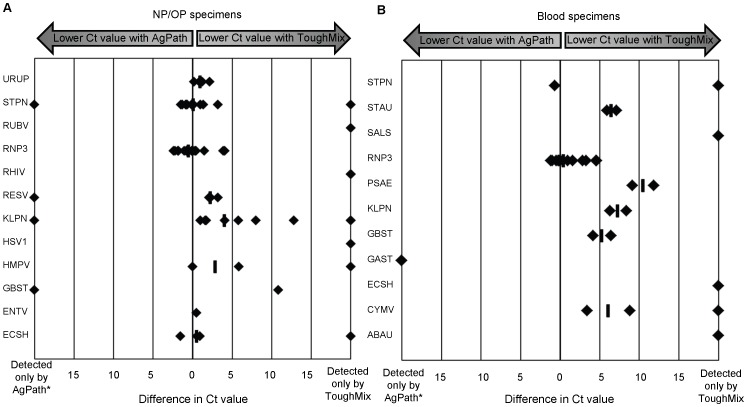
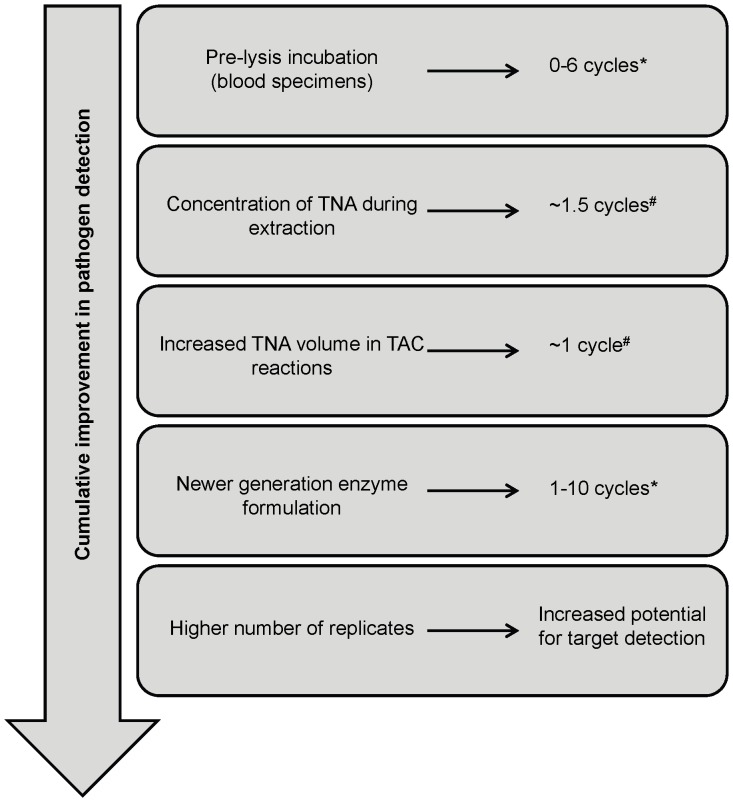
Identification of etiology remains a significant challenge in the diagnosis of infectious diseases, particularly in resource-poor settings. Viral, bacterial, and fungal pathogens, as well as parasites, play a role for many syndromes, and optimizing a single diagnostic system to detect a range of pathogens is challenging. The TaqMan Array Card (TAC) is a multiple-pathogen detection method that has previously been identified as a valuable technique for determining etiology of infections and holds promise for expanded use in clinical microbiology laboratories and surveillance studies. We selected TAC for use in the Aetiology of Neonatal Infection in South Asia (ANISA) study for identifying etiologies of severe disease in neonates in Bangladesh, India, and Pakistan. Here we report optimization of TAC to improve pathogen detection and overcome technical challenges associated with use of this technology in a large-scale surveillance study. Specifically, we increased the number of assay replicates, implemented a more robust RT-qPCR enzyme formulation, and adopted a more efficient method for extraction of total nucleic acid from blood specimens. We also report the development and analytical validation of ten new assays for use in the ANISA study. Based on these data, we revised the study-specific TACs for detection of 22 pathogens in NP/OP swabs and 12 pathogens in blood specimens as well as two control reactions (internal positive control and human nucleic acid control) for each specimen type. The cumulative improvements realized through these optimization studies will benefit ANISA and perhaps other studies utilizing multiple-pathogen detection approaches. These lessons may also contribute to the expansion of TAC technology to the clinical setting.


Conflict of interest statement

Competing Interests: The authors have declared that no competing interests exist.

Figures

Figure 1
Figure 1. ANISA-specific TAC configurations.
Original ANISA NP/OP TAC, Original ANISA Blood TAC, Optimization TAC, Revised ANISA NP/OP TAC, Revised ANISA Blood TAC. Target designations include: MYPN, Mycoplasma pneumoniae; CHTR, Chlamydia trachomatis; CHPN, Chlamydophila pneumoniae; URUP, Ureaplasma spp.; BOP1, Bordetella pertussis; ADEV, Adenovirus; FLUA, Influenza A; FLUB, Influenza B; PIV1, Parainfluenza virus 1; PIV2, Parainfluenza virus 2; PIV3, Parainfluenza virus 3; RESV, Respiratory Syncytial Virus; HPEV, Human Parechovirus; IPCO, Internal Positive Control; GADH, Glyceraldehyde phosphate dehydrogenase (Manufacturing control); ENTV, Enterovirus; HMPV, Human Metapneumovirus; RUBV, Rubella virus; STPN, Streptococcus pneumoniae; KLPN, Klebsiella pneumoniae; ECSH, Escherichia coli/Shigella spp.; RHIV, Rhinovirus; GBST, Group B Streptococcus; HSV1, Herpes Simplex Virus 1; HSV2, Herpes Simplex Virus 2; RNP3, Human RNaseP; STAU, Staphylococcus aureus; GAST, Group A Streptococcus; PSAE, Pseudomonas aeruginosa; HIAT, Haemophilus influenzae; HITB, Haemophilus influenzae type B; SALS, Salmonella spp.; ABAU, Acinetobacter baumannii; CYMV, Cytomegalovirus; TOXG, Toxoplasma gondii; NMEN, Neisseria meningitidis. All oligonucleotides were spotted at 1× final concentration except where noted by * where concentration is 2×. #Duplex assay consisting of RNP3 assay with FAM-labeled probe and IPCO assay with VIC-labeled probe.
Figure 2
Figure 2. Effect of lytic enzyme treatment on extraction of nucleic acid from blood specimens.
Average Ct value of individual real-time PCR reactions (n = 4) containing TNA extracted from healthy donor blood spiked with serial dilutions of S. pyogenes (A), S. aureus (B), or K. pneumoniae (C) without treatment or after incubation with TE buffer alone or TE buffer with lytic enzymes (lysozyme, lysostaphin, and mutanolysin) at 37°C for 30 min. (D) Ct values of serial dilutions of K. pneumoniae spiked into saline (to mimic NP/OP swab) or blood. Error bars display standard deviation. *p<0.0001 compared to no treatment. # p<0.05 compared to same concentration of organisms in saline.
Figure 3
Figure 3. Concordance between replicates of primary clinical specimens tested on TAC.
Concordance between replicate results for NP/OP (A) and blood (B) specimens tested using TAC. Data shown are total number of specimens identified as positive in at least one replicate reaction (white bars) and proportion of positive specimens for which greater than 50% of replicates were positive (shaded bars). Number of replicates tested varied by target and specimen type; all targets were tested in ≥2 replicates. Total number of specimens tested, NP/OP (n = 124), blood (n = 661).
Figure 4
Figure 4. Effect of enzyme system on detection of pathogen targets in primary clinical specimens.
Data shown are difference in Ct value between reactions using Quanta One-step RT-PCR ToughMix and AgPath-ID One-step RT-PCR kit when testing TNA extracted from NP/OP swabs (A) or blood (B). Each data point represents the difference in Ct value between the two reactions for an individual clinical specimen. Median difference is indicated () for assays with ≥2 positive results. *Targets that were only detected using AgPath always occurred when Ct values were >33.
Figure 5
Figure 5. Cumulative improvement of pathogen detection with optimization of experimental parameters.
Potential improvement in Ct value (number of cycles) achieved by optimizing each experimental parameter. *Number of cycles gained varies based on organism, target, and specimen type. #Theoretical improvement calculated based on assumption of 3.3 cycle difference with 10-fold change in nucleic acid concentration.

References

    1. Lee WM, Grindle K, Pappas T, Marshall DJ, Moser MJ, et al. (2007) High-throughput, sensitive, and accurate multiplex PCR-microsphere flow cytometry system for large-scale comprehensive detection of respiratory viruses. J Clin Microbiol 45: 2626–2634. - PMC - PubMed
    1. Templeton KE, Scheltinga SA, van den Eeden WC, Graffelman AW, van den Broek PJ, et al. (2005) Improved diagnosis of the etiology of community-acquired pneumonia with real-time polymerase chain reaction. Clin Infect Dis 41: 345–351. - PMC - PubMed
    1. Jain S, Self WH, Wunderink RG, Fakhran S, Balk R, et al.. (2012) Etiology of Community-acquired Pneumonia among Hospitalized Adults in the United States: Preliminary Data from the CDC Etiology of Pneumonia in the Community (EPIC) Study, abstr 676.
    1. Jain S, Ampofo K, Arnold SR, Williams DJ, Anderson E, et al.. (2012) Etiology of Community-acquired Pneumonia among Hospitalized Children in the United States: Preliminary Data from the CDC Etiology of Pneumonia in the Community (EPIC) Study, abstr 168.
    1. Marrie TJ, Costain N, La SB, Patrick W, Forgie S, et al. (2012) The role of atypical pathogens in community-acquired pneumonia. Semin Respir Crit Care Med 33: 244–256. - PubMed

Publication types