

Vitamin D Receptor Gene Expression and Function in a South African Population: Ethnicity, Vitamin D and FokI
- PMID: 23805323
- PMCID: PMC3689684
- DOI: 10.1371/journal.pone.0067663
Vitamin D Receptor Gene Expression and Function in a South African Population: Ethnicity, Vitamin D and FokI
Abstract
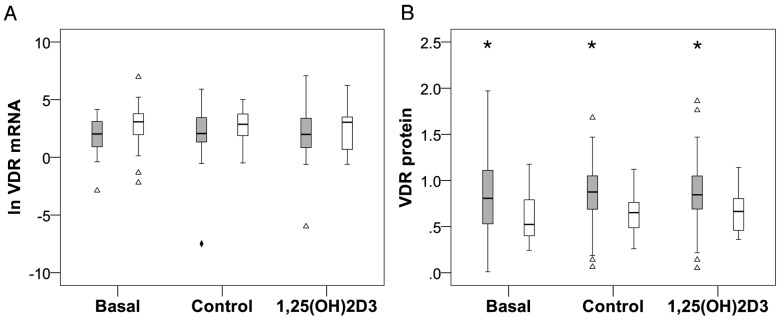
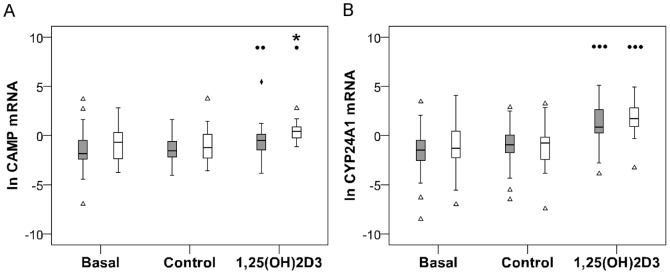
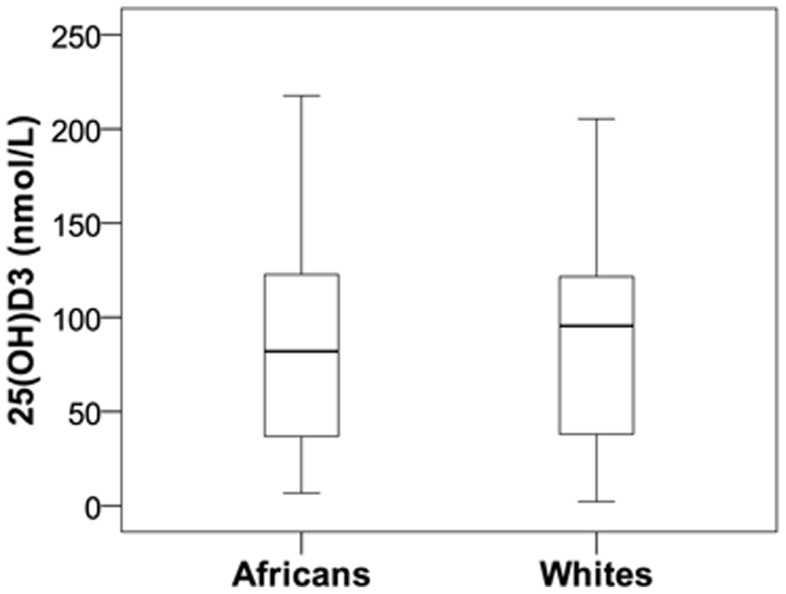
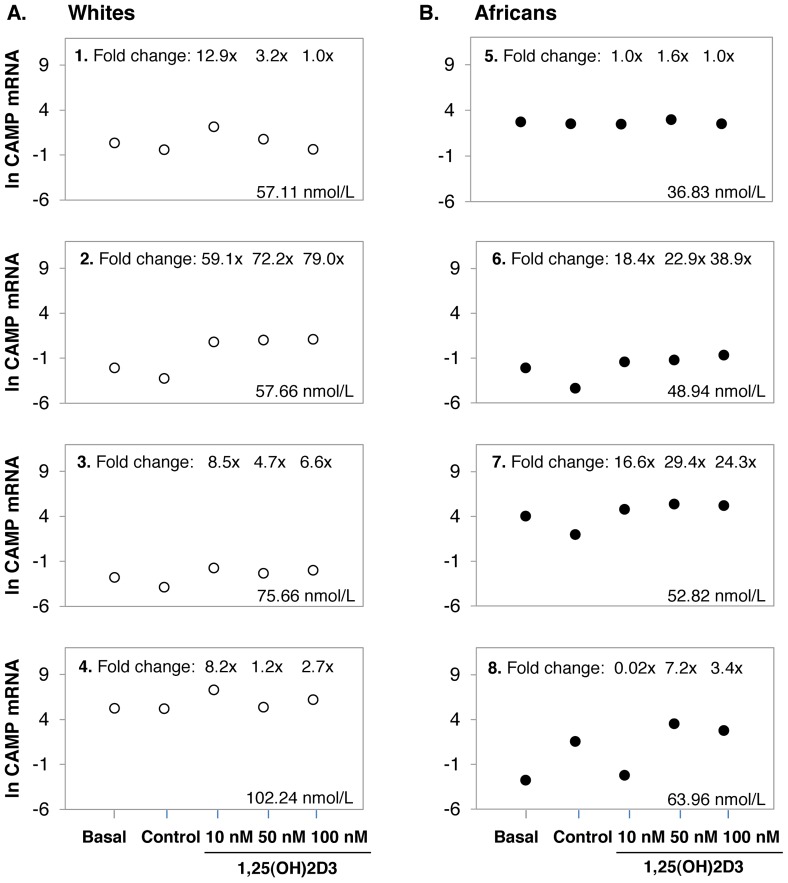
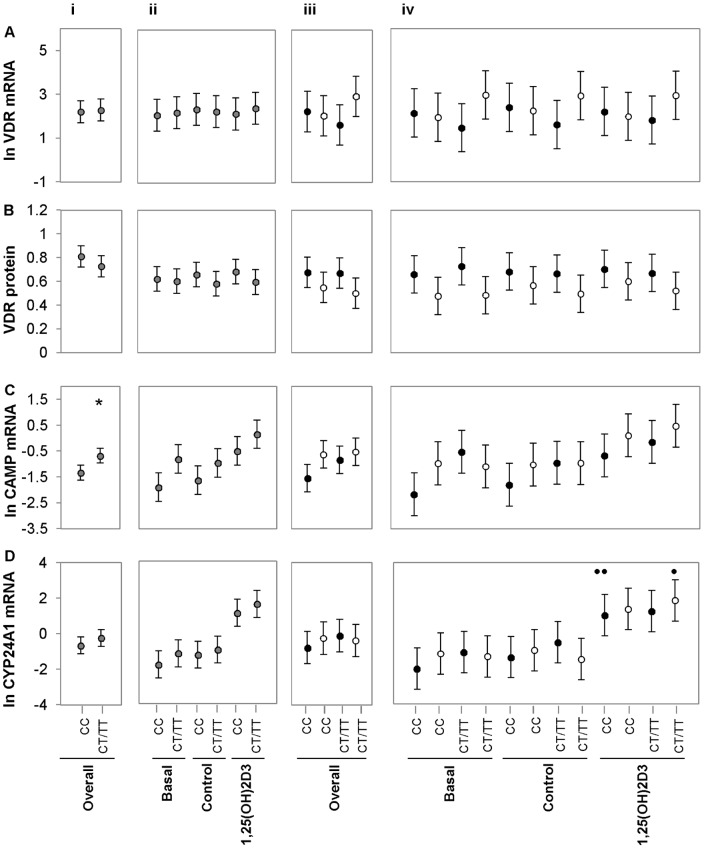
Polymorphisms of the vitamin D receptor gene (VDR) have been associated inconsistently with various diseases, across populations of diverse origin. The T(f) allele of the functional SNP FokI, in exon 2 of VDR, results in a longer vitamin D receptor protein (VDR) isoform, proposed to be less active. Genetic association of VDR with disease is likely confounded by ethnicity and environmental factors such as plasma 25(OH)D3 status. We hypothesized that VDR expression, VDR level and transactivation of target genes, CAMP and CYP24A1, depend on vitamin D, ethnicity and FokI genotype. Healthy volunteers participated in the study (African, n = 40 and White, n = 20). Plasma 25(OH)D3 levels were quantified by LC-MS and monocytes cultured, with or without 1,25(OH)2D3. Gene expression and protein level was quantified using qRT-PCR and flow cytometry, respectively. Mean plasma 25(OH)D3 status was normal and not significantly different between ethnicities. Neither 25(OH)D3 status nor 1,25(OH)2D3 supplementation significantly influenced expression or level of VDR. Africans had significantly higher mean VDR protein levels (P<0.050), nonetheless transactivated less CAMP expression than Whites. Genotyping the FokI polymorphism by pyrosequencing together with HapMap data, showed a significantly higher (P<0.050) frequency of the CC genotype in Africans than in Whites. FokI genotype, however, did not influence VDR expression or VDR level, but influenced overall transactivation of CAMP and 1,25(OH)2D3-elicited CYP24A1 induction; the latter, interacting with ethnicity. In conclusion, differential VDR expression relates to ethnicity, rather than 25(OH)D3 status and FokI genotype. Instead, VDR transactivation of CAMP is influenced by FokI genotype and, together with ethnicity, influence 1,25(OH)2D3-elicited CYP24A1 expression. Thus, the expression and role of VDR to transactivate target genes is determined not only by genetics, but also by ethnicity and environment involving complex interactions which may confound disease association.
Conflict of interest statement
Figures

Similar articles
-
VDR FokI polymorphism is associated with a reduced T-helper cell population under vitamin D stimulation in type 1 diabetes patients.J Steroid Biochem Mol Biol. 2015 Apr;148:184-6. doi: 10.1016/j.jsbmb.2015.01.003. Epub 2015 Jan 7. J Steroid Biochem Mol Biol. 2015. PMID: 25576905
-
Ancestry-Adjusted Vitamin D Metabolite Concentrations in Association With Cytochrome P450 3A Polymorphisms.Am J Epidemiol. 2018 Apr 1;187(4):754-766. doi: 10.1093/aje/kwx187. Am J Epidemiol. 2018. PMID: 28673024 Free PMC article.
-
[Influence of vitamin D receptor FokI polymorphism on expression of CYP24A1 in periodontal cells].Beijing Da Xue Xue Bao Yi Xue Ban. 2018 Feb 18;50(1):13-19. Beijing Da Xue Xue Bao Yi Xue Ban. 2018. PMID: 29483716 Chinese.
-
Vitamin D status and gene transcription in immune cells.J Steroid Biochem Mol Biol. 2013 Jul;136:83-5. doi: 10.1016/j.jsbmb.2013.02.005. Epub 2013 Feb 13. J Steroid Biochem Mol Biol. 2013. PMID: 23416105 Review.
-
Associations among four polymorphisms (BsmI, FokI, TaqI and ApaI) of vitamin D receptor gene and end-stage renal disease: a meta-analysis.Arch Med Res. 2015 Jan;46(1):1-7. doi: 10.1016/j.arcmed.2014.11.017. Epub 2014 Nov 27. Arch Med Res. 2015. PMID: 25434518 Review.
Cited by
-
Vitamin D receptor gene polymorphisms and susceptibility to urolithiasis: a meta-regression and meta-analysis.BMC Nephrol. 2020 Jul 10;21(1):263. doi: 10.1186/s12882-020-01919-1. BMC Nephrol. 2020. PMID: 32650740 Free PMC article.
-
Vitamin D receptor polymorphisms or serum levels as key drivers of breast cancer development? The question of the vitamin D pathway.Oncotarget. 2017 Feb 21;8(8):13142-13156. doi: 10.18632/oncotarget.14482. Oncotarget. 2017. PMID: 28061456 Free PMC article.
-
Genetic Risk of Rheumatoid Arthritis: A Case Control Study.Biochem Genet. 2024 Oct;62(5):3624-3641. doi: 10.1007/s10528-023-10648-7. Epub 2023 Dec 30. Biochem Genet. 2024. PMID: 38160213 Free PMC article.
-
Non-genomic rewiring of vitamin D receptor to p53 as a key to Alzheimer's disease.Aging Cell. 2021 Dec;20(12):e13509. doi: 10.1111/acel.13509. Epub 2021 Nov 2. Aging Cell. 2021. PMID: 34725922 Free PMC article.
-
The Association of Vitamin D Receptor Polymorphisms with Multiple Sclerosis in a Case-Control Study from Kuwait.PLoS One. 2015 Nov 5;10(11):e0142265. doi: 10.1371/journal.pone.0142265. eCollection 2015. PLoS One. 2015. PMID: 26540116 Free PMC article.
References
-
- Baeke F, Takiishi T, Korf H, Gysemans C, Mathieu C (2011) Vitamin D: modulator of the immune system. Curr Opin Pharmacol 10: 482–496. - PubMed
-
- Haussler MR, Whitfield GK, Kaneko I, Haussler CA, Hsieh D, et al. (2013) Molecular Mechanisms of Vitamin D Action. Calcif Tissue Int 92: 77–98. - PubMed
-
- Zierold C, Darwish HM, DeLuca HF (1995) Two Vitamin D Response Elements Function in the Rat 1,25-dihydroxyvitamin D 24-Hydroxylase. J Biol Chem 270(4): 1675–78. - PubMed
MeSH terms
Substances
LinkOut - more resources
Full Text Sources
Other Literature Sources
Medical
Miscellaneous
