. 2013:161:333-45; discussion 419-59.
doi: 10.1039/c2fd20108a.

Formation and analysis of topographical domains between lipid membranes tethered by DNA hybrids of different lengths

Affiliations

Formation and analysis of topographical domains between lipid membranes tethered by DNA hybrids of different lengths

Minsub Chung et al. Faraday Discuss. 2013.

Abstract

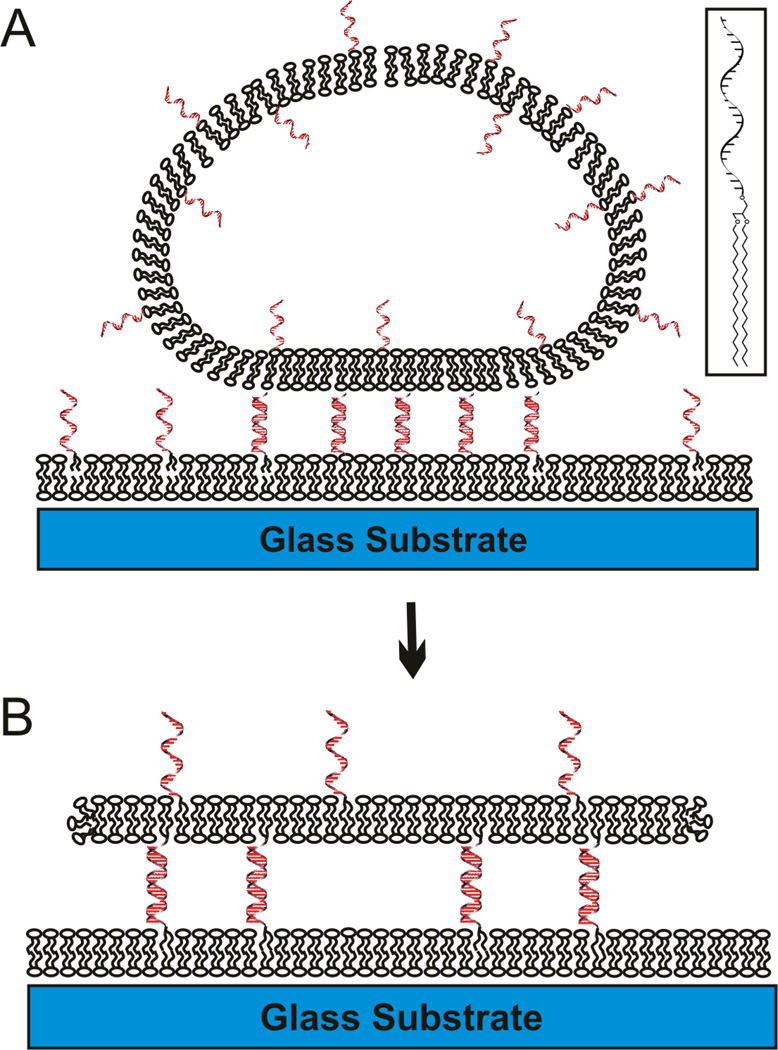
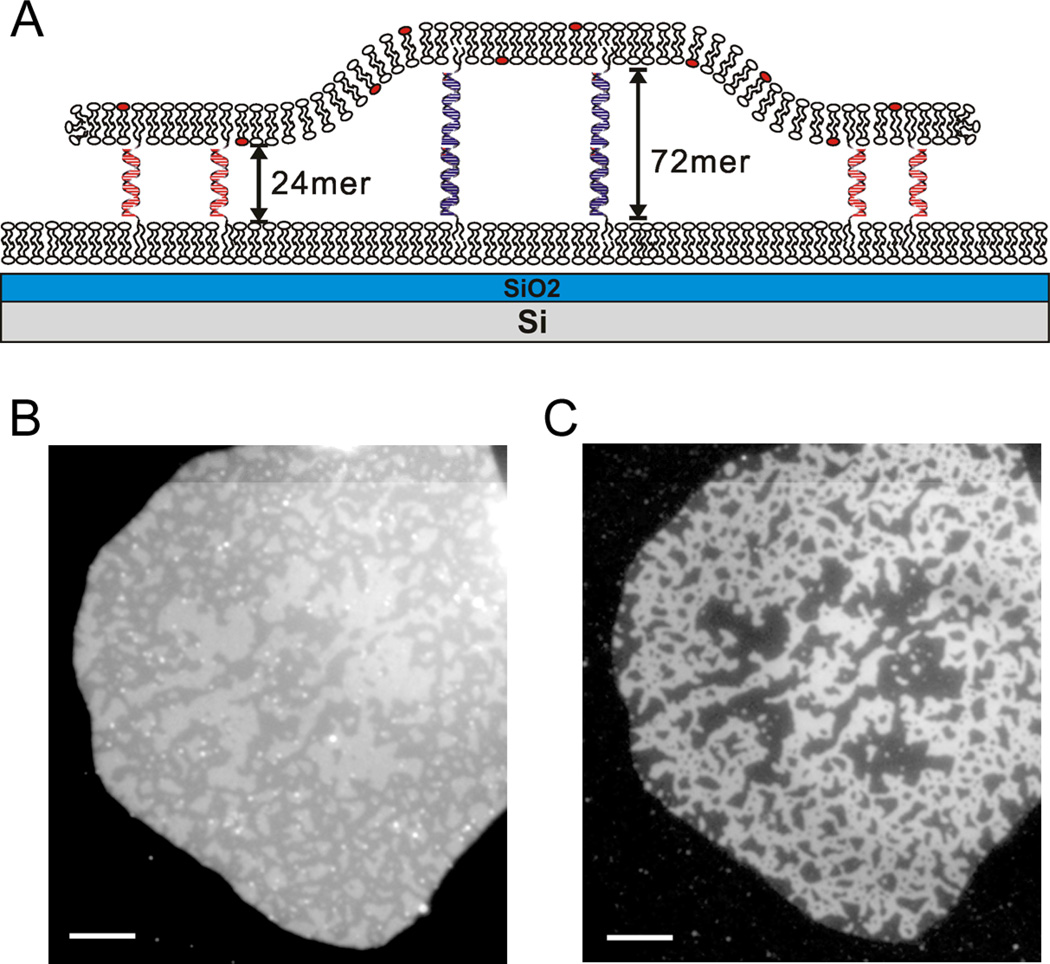
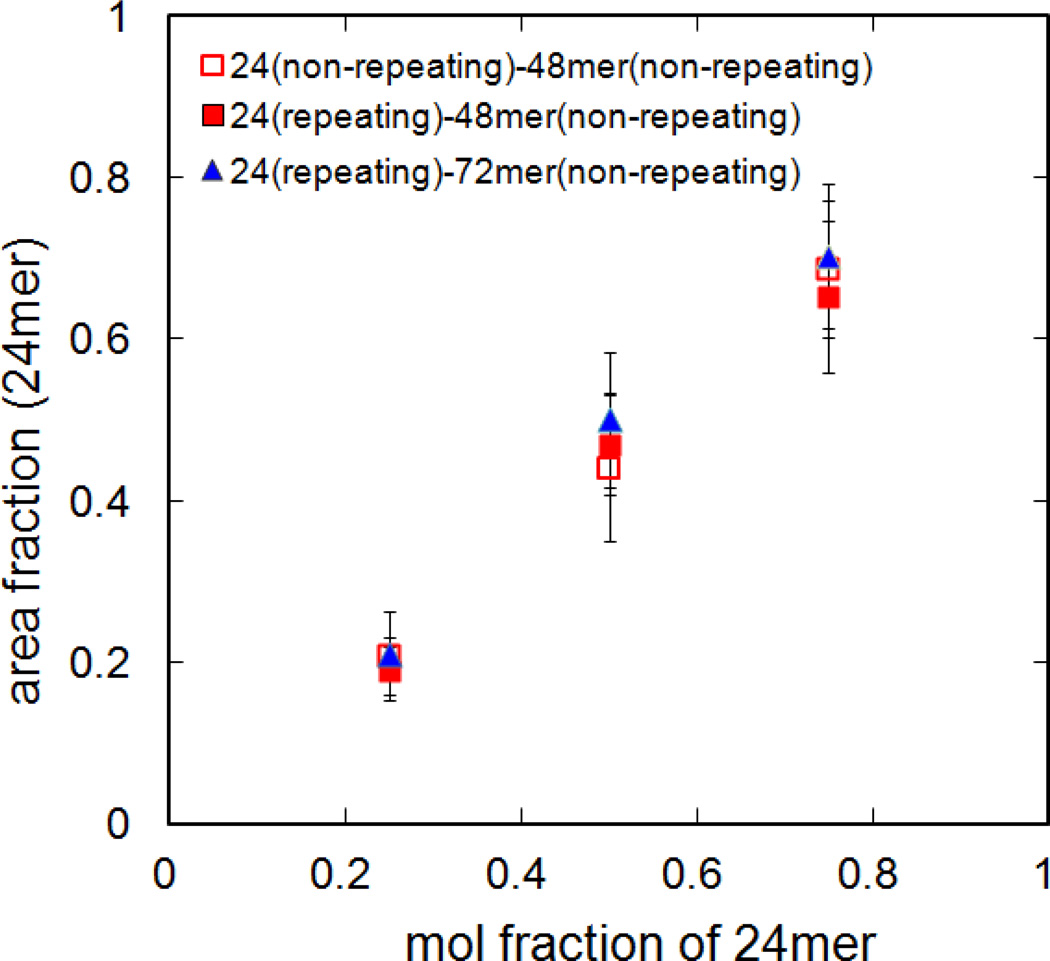
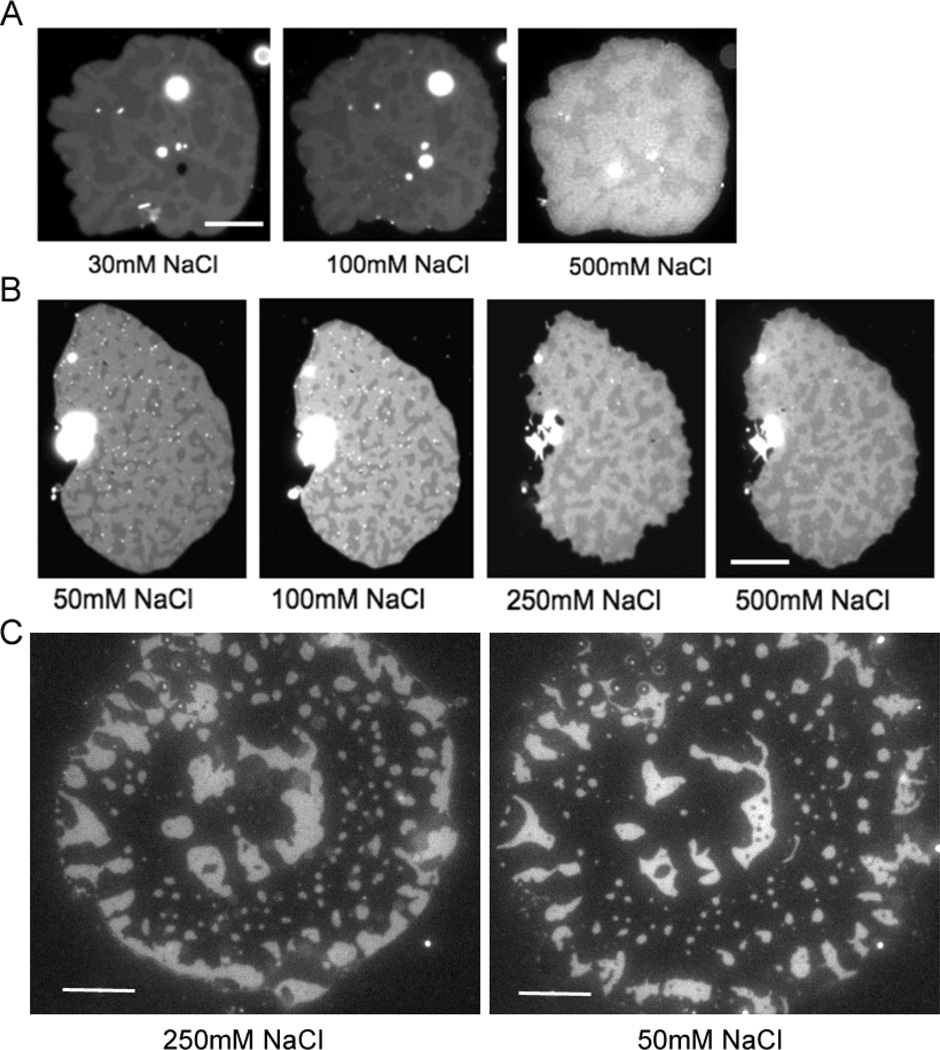
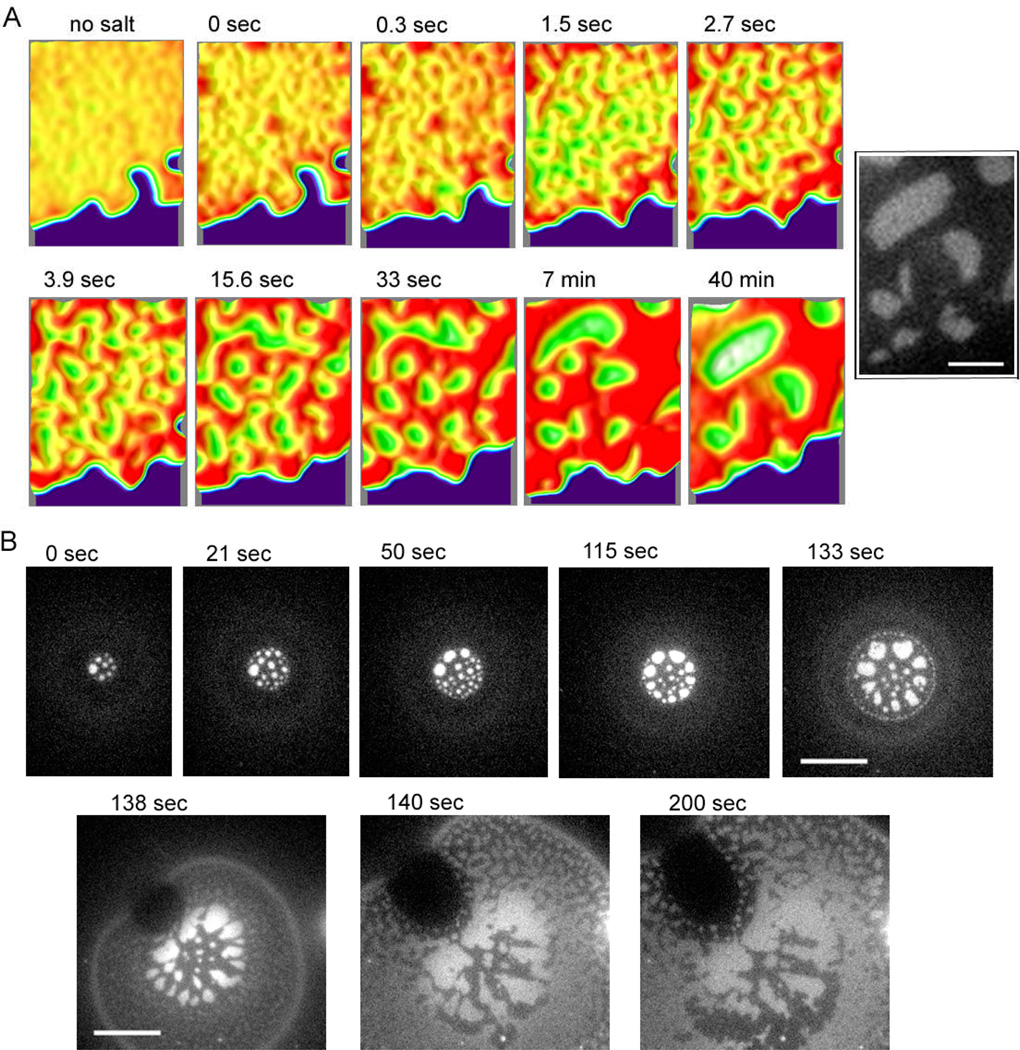
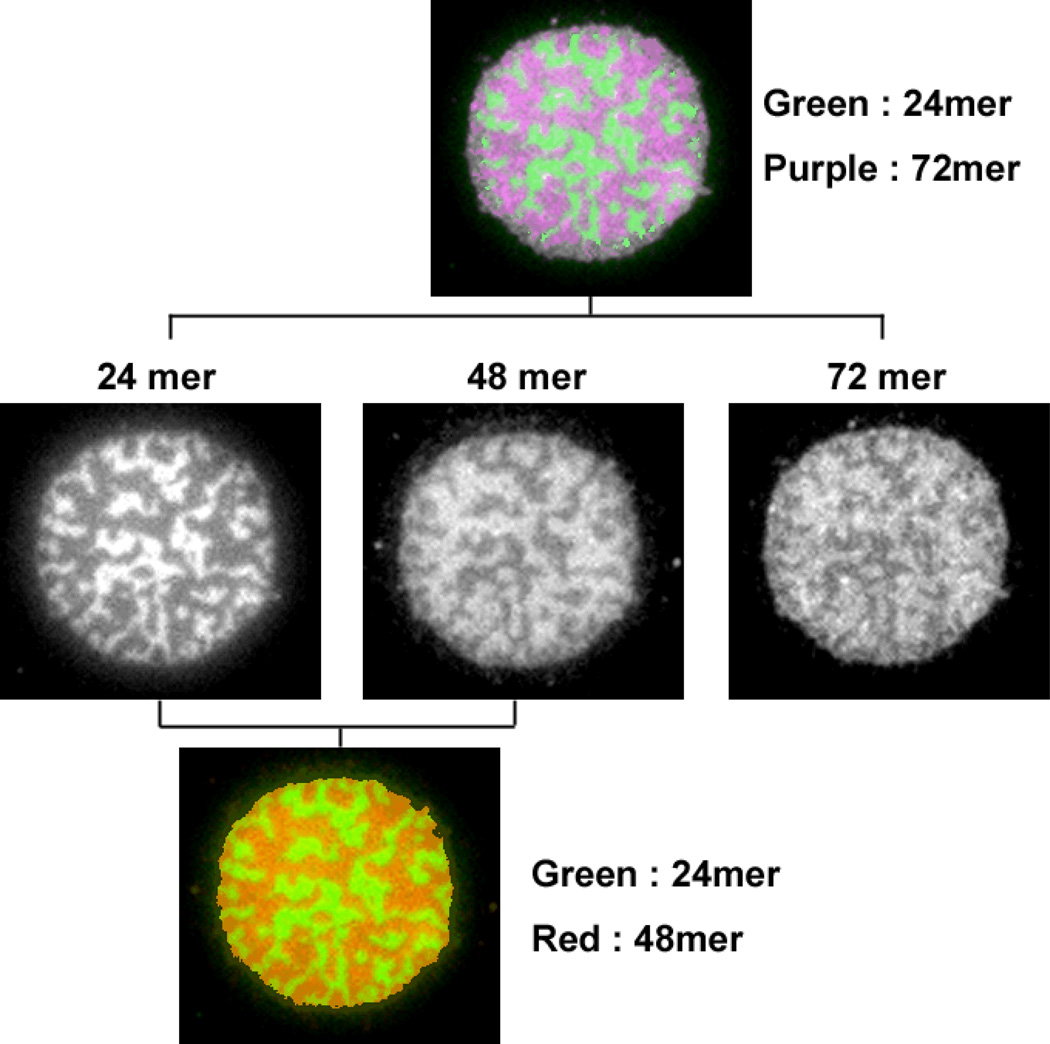
We recently described a strategy to prepare DNA-tethered lipid membranes either to fixed DNA on a surface or to DNA displayed on a supported bilayer [Boxer et al., J. Struct. Biol., 2009, 168, 190; Boxer et al., Langmuir, 2011, 27, 5492]. With the latter system, the DNA hybrids are laterally mobile; when orthogonal sense-antisense pairs of different lengths are used, the DNA hybrids segregate by height and the tethered membrane deforms to accommodate the height difference. This architecture is particularly useful for modelling interactions between membranes mediated by molecular recognition and resembles cell-to-cell junctions. The length, affinity and population of the DNA hybrids between the membranes are completely controllable. Interesting patterns of height segregation are observed by fluorescence interference contrast microscopy. Diverse behavior is observed in the segregation and pattern forming process and possible mechanisms are discussed. This model system captures some of the essential physics of synapse formation and is a step towards understanding lipid membrane behaviour in cell-to-cell junctions.


Figures

Fig. 1
Fig. 1
Schematic illustration of DNA-tethered lipid bilayer patches formation by GUV rupture on supported lipid bilayers, where DNA tethers are laterally mobile (not drawn to scale). When GUVs presenting the DNA are added onto a supported lipid bilayer presenting complementary DNA, GUVs are flattened (A) upon DNA binding, and some of them rupture to form a DNA-tethered membrane (B). The gap between membranes is precisely controllable by adjusting the DNA length. The inset shows the chemical structure of DNA-lipid conjugate.
Fig. 2
Fig. 2
(A) Schematic illustration of a height segregated DNA-tethered bilayer patch with 24mer and 72mer DNAs. In some cases, as illustrated, the substrate is SiO2 grown on flat Si, a highly reflective mirror, to differentiate height differences by fluorescence intensity using FLIC (not drawn to scale). (B) The height variation in a tethered bilayer patch containing TR labeled lipid and containing a 1:1 mixture of Alexa 488 labeled 24mer and unlabeled 72mer DNA-lipid conjugate is visualized by FLIC (260 nm thickness of SiO2 on Si). The different height regions are distinguished by the intensity variation in TR emission in the tethered patch membrane: bright (higher) domains are the 72 mer and dim (lower) 24mer segregated domains are evident. (C) The same patch is visualized with Alexa 488 (right) attached on the membrane distal end of the 24mer. The dimmer 24mer regions in panel B completely overlap with Alexa 488 in panel C. Because fluorescence images offer more contrast than FLIC, Alexa 488 labeled DNA-lipid conjugates can be used as a surrogate marker for topological domains. Scale bar is 10 µm.
Fig. 3
Fig. 3
Area fraction of 24mer topological domains as a function of the mol fraction of the 24mer DNA. The domain height difference was varied by using either a 72mer (triangle) or 48mer (square), and the effect of DNA sequence was compared by using repeating sequence (poly24A/T, see table 1; solid symbols) or the fully overlapping sequence (24-1/2; open symbols). The 48mer (48-1/2) and 72mer (72-1/2) were fully overlapping sequences. The high and low regions were differentiated by either FLIC or labelled DNA. All data for patches in 10mM phosphate buffer with 100mM NaCl, pH 7.4.
Fig. 4
Fig. 4
Pattern change with salt concentration. (A) A patch containing 1:1 ratio of 24mer (repeating sequence, bright region) and 48mer (overlapping sequence, dark region) was imaged by FLIC on 260 nm SiO2 visualizing TR-labelled lipid. The pattern change was monitored with varying NaCl concentration. The contrast of the 500 mM picture was enhanced to compensate for photobleaching. (B) A patch contains 1:1 ratio of 24mer (overlapping sequence, dark region) and 48mer (overlapping sequence, bright region) and was imaged by FLIC on 380 nm SiO2. (C) The pattern change with decreasing salt from 250 mM to 50 mM NaCl was monitored by Alexa 488 labelled poly24A. The patch contains 1:1 ratio of 24mer and 48mer and was imaged by normal epi-fluorescence microscopy. Because the 250 mM image was captured when the patch is still spreading, the edge of patch became expanded in the 50 mM image. Scale bar is 10 µm.
Fig. 5
Fig. 5
Topological pattern evolution process during GUV adhesion and patch formation monitored with Alexa 488 labelled 24mer DNA by epi-fluorescence microscopy. GUVs displaying Alexa 488 labelled 24mer and unlabelled 48mer were bound on a supported bilayer displaying the complementary DNA where they flatten and rupture to form patches (see Fig. 1). (A) A tethered patch was formed, then the DNA tethers were un-hybridized by removing salt, and DNA hybridization was re-initiated by adding salt so that initial state of segregation in the tethered patches could be observed under controlled conditions. The DNAs become uniformly distributed after several minutes incubation in deionized water (no salt), then the salt was added, and after a few seconds, the patch became slightly rough, which is set as 0 sec. The segregation by tether length occurred rapidly, forming small 24mer (bright) and 48mer domains (~ 3 sec). The randomly distributed small domains gradually merged and became rounder in shape (~ 7 min); this segregation process continued, but became very slow after 10 min. The surface topology of the segregated patch is reconstituted for enhanced contrast by using ImageJ (v2.41) interactive 3D surface plot plug-in with thermal colour scale (red is high and blue is low). Inverted brightness was used for the patch area to depict realistic domain height – making the higher 48mer region brighter. The black and white inset is the original image at 40 min for reference. (B) Initial domain formation process as a GUV flattens and the binding area expands. Initially, circular bright 24mer domains were generated, arranged roughly concentrically (0~133sec). After the GUV ruptured and formed a patch (see Fig. 1), the circular 24mer domains became amorphous, and small segregated topological domains develop in new binding regions (138 sec). The new domains then started to merge with the already formed domains inside (~200 sec). Scale bar is 3 µm for (A) and 10 µm for (B).
Fig. 6
Fig. 6
A patch with three different lengths of DNA that are labelled by fluorescence dye. Each DNA occupied regions imaged by corresponding fluorescence is shown for side-by-side comparison. Alexa 488 labelled 24mer is shown with green colour, and Cy5 labelled 48mer is red, and Cy3.5 labelled 72mer is purple in the overlay image.

References

    1. Chung M, Lowe RD, Chan YH, Ganesan PV, Boxer SG. J Struct Biol. 2009;168:190–199. - PMC - PubMed
    1. Chung M, Boxer SG. Langmuir. 2011;27:5492–5497. - PMC - PubMed
    1. Gumbiner BM. Cell. 1996;84:345–357. - PubMed
    1. Dustin ML, Bivona TG, Philips MR. Nat Immunol. 2004;5:363–372. - PubMed
    1. Weber T, Zemelman BV, McNew JA, Westermann B, Gmachl M, Parlati F, Sollner TH, Rothman JE. Cell. 1998;92:759–772. - PubMed

Publication types