. 2013 Jun 28:14:429.
doi: 10.1186/1471-2164-14-429.

The duration of gastrin treatment affects global gene expression and molecular responses involved in ER stress and anti-apoptosis

Affiliations

The duration of gastrin treatment affects global gene expression and molecular responses involved in ER stress and anti-apoptosis

Linn-Karina M Selvik et al. BMC Genomics. .

Abstract

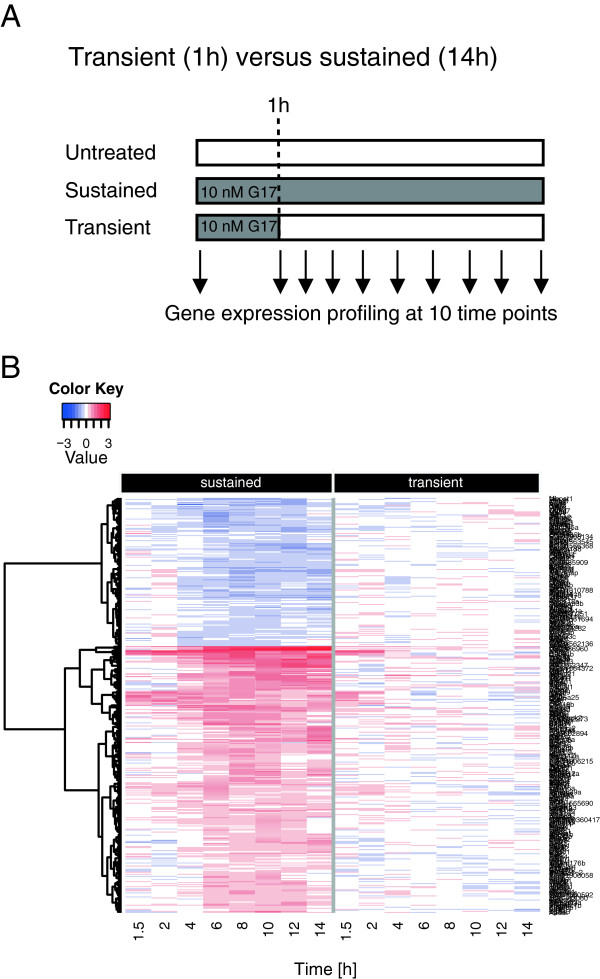
Background: How cells decipher the duration of an external signal into different transcriptional outcomes is poorly understood. The hormone gastrin can promote a variety of cellular responses including proliferation, differentiation, migration and anti-apoptosis. While gastrin in normal concentrations has important physiological functions in the gastrointestine, prolonged high levels of gastrin (hypergastrinemia) is related to pathophysiological processes.

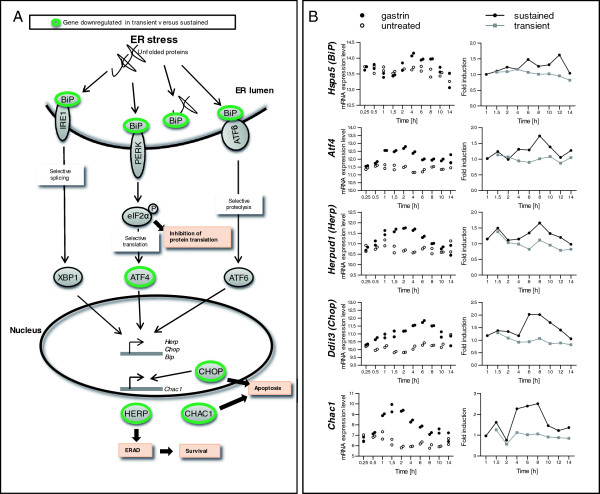
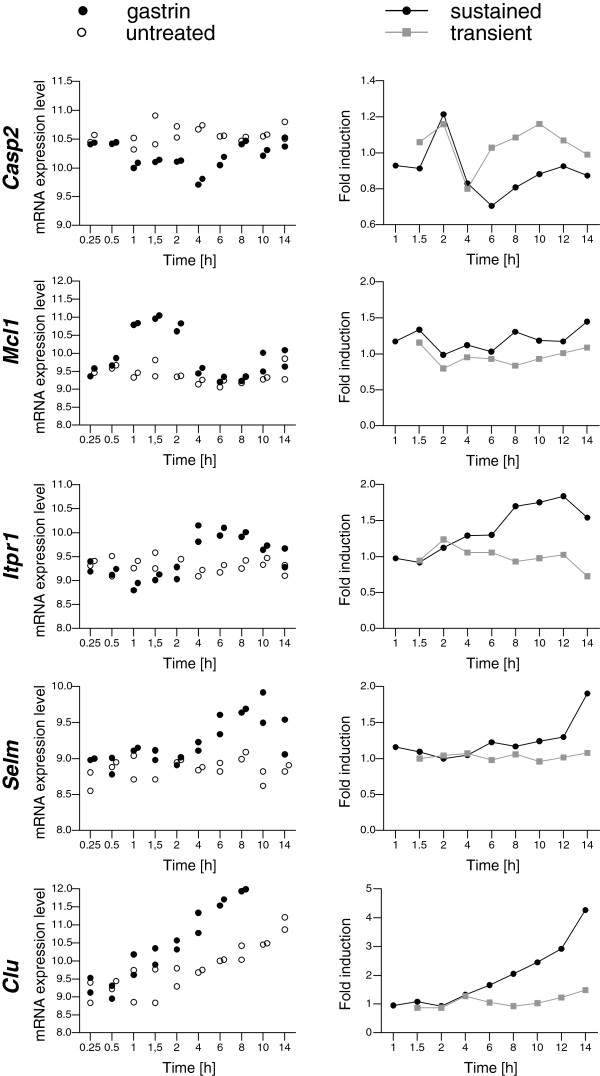
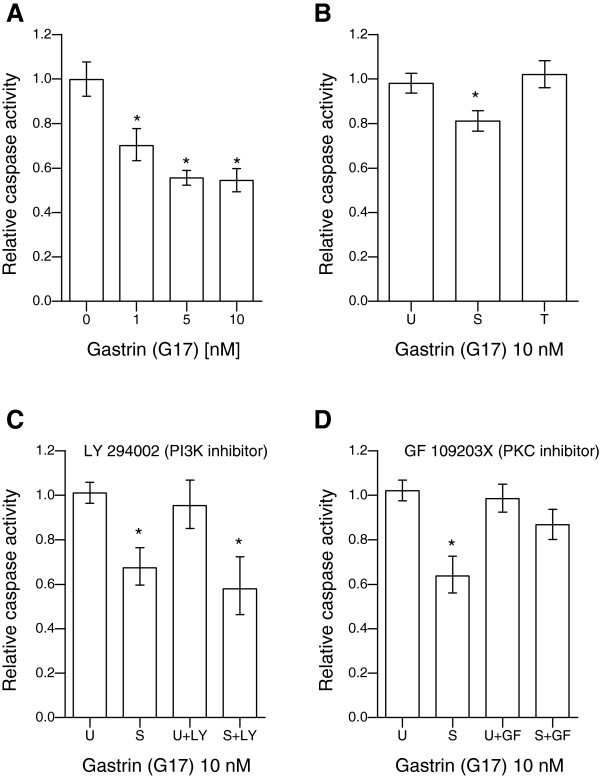
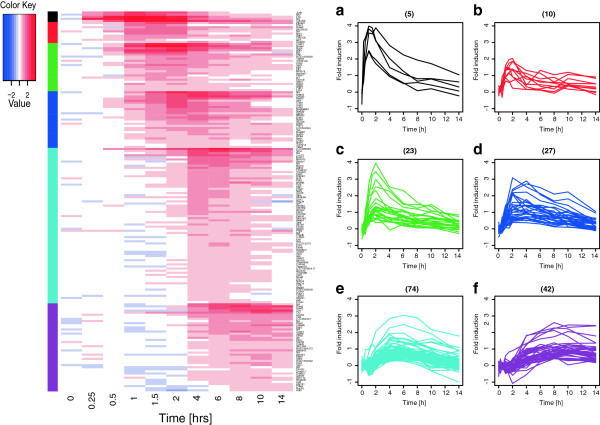
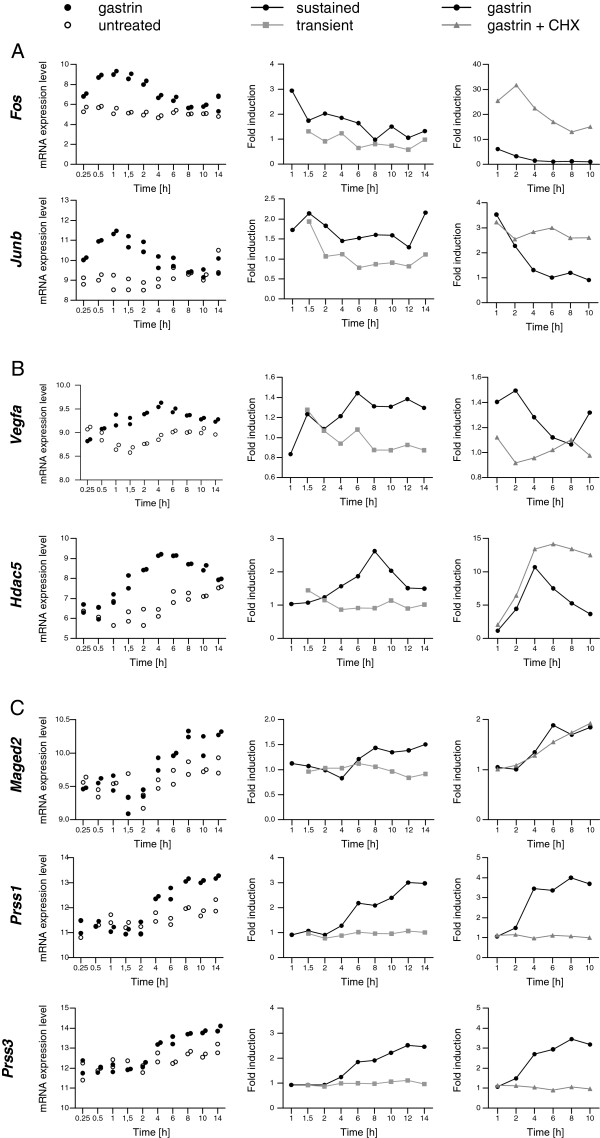
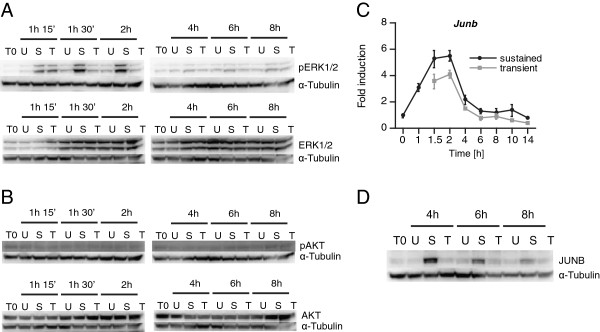
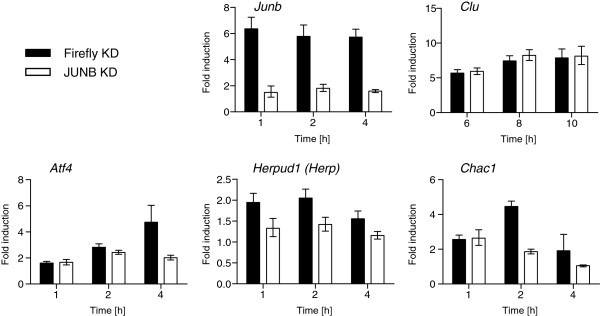
Results: We have used genome-wide microarray time series analysis and molecular studies to identify genes that are affected by the duration of gastrin treatment in adenocarcinoma cells. Among 403 genes differentially regulated in transiently (gastrin removed after 1 h) versus sustained (gastrin present for 14 h) treated cells, 259 genes upregulated by sustained gastrin treatment compared to untreated controls were expressed at lower levels in the transient mode. The difference was subtle for early genes like Junb and c-Fos, but substantial for delayed and late genes. Inhibition of protein synthesis by cycloheximide was used to distinguish between primary and secondary gastrin regulated genes. The majority of gastrin upregulated genes lower expressed in transiently treated cells were primary genes induced independently of de novo protein synthesis. This indicates that the duration effect of gastrin treatment is mainly mediated via post-translational signalling events, while a smaller fraction of the differentially expressed genes are regulated downstream of primary transcriptional events. Indeed, sustained gastrin treatment specifically induced prolonged ERK1/2 activation and elevated levels of the AP-1 subunit protein JUNB. Enrichment analyses of the differentially expressed genes suggested that endoplasmic reticulum (ER) stress and survival is affected by the duration of gastrin treatment. Sustained treatment exerted an anti-apoptotic effect on serum starvation-induced apoptosis via a PKC-dependent mechanism. In accordance with this, only sustained treatment induced anti-apoptotic genes like Clu, Selm and Mcl1, while the pro-apoptotic gene Casp2 was more highly expressed in transiently treated cells. Knockdown studies showed that JUNB is involved in sustained gastrin induced expression of the UPR/ER stress related genes Atf4, Herpud1 and Chac1.

Conclusion: The duration of gastrin treatment affects both intracellular signalling mechanisms and gene expression, and ERK1/2 and AP-1 seem to play a role in converting different durations of gastrin treatment into distinct cellular responses.


Figures

Figure 1
Figure 1
Gene expression in transiently and sustained gastrin treated cells. A: Schematic representation of stimulation protocol. Post confluent AR42J cells were serum starved for 20–24 h before 10 nM gastrin was added. Sustained treated cells (continuous presence of gastrin) were harvested at 9 different time points between 1 and 14 h. Transiently treated cells (gastrin removed after 1 h) were harvested at 8 different time points between 1.5 and 14 h. Untreated control cells were harvested at time point zero and throughout the time course (10 time points). B: Heat map of genes differentially expressed in transiently versus sustained treated cells. Temporal gene expression profiles of genes up- and down-regulated in sustained treated cells compared to untreated controls were hierarchical clustered and matched to temporal gene expression in transiently treated cells compared to untreated controls. The heat map shows average temporal gene expression in two independent experiments. The dendrogram is related to the hierarchical clustering of the first independent experiment with sustained treated cells.
Figure 2
Figure 2
Genes involved in the unfolded protein response (UPR) differ in transiently versus sustained gastrin treated cells. A: Schematic presentation of the three signalling pathways initiated by the stress sensors IRE1, PERK and ATF6 in the UPR. The green circles indicate genes differentially expressed in transiently versus sustained gastrin treated cells. IRE1, PERK and ATF6 are associated with the protein chaperone BiP (HSPA5/GRP78) in their inactive state. In response to stress, unfolded proteins accumulate and bind to BiP, leading to release and activation of the three stress sensors and activation of their respective pathways: IRE1 activates and initiates nonconventional splicing of Xbp1 mRNA. PERK phosphorylates eIF2α leading to a general attenuation of translational initiation and a selective induction of ATF4 translation. ATF6 transits to the Golgi where it is cleaved to yield a cytoplasmic fragment which moves into the nucleus. XBP1, ATF4 and ATF6 activate a wide variety of UPR target genes, including BiP, Chop, Herp and Chac1 [16,20,21]. B: Data from two independent time series microarray experiments showing time profiles for UPR genes differentially expressed in transiently versus sustained gastrin treated cells. Left panels: The data were extracted from a time series experiment where sustained gastrin treated cells were harvested at 10 different time points between 15 min and 14 h. The samples from untreated control cells were harvested at time zero and throughout the time course (11 time points). The mRNA expression level for untreated (open dots) and sustained gastrin treated (black dots) cells are shown as normalized log2-transformed signal intensities (N=2). Right panels: Gastrin induced gene expression in transiently (grey lines) and sustained (black lines) treated cells (stimulation protocol presented in Figure 1). The data is shown as mean fold induction relative to untreated cells at the same time point (N=2).
Figure 3
Figure 3
Pro- and anti-apoptotic genes are differentially expressed in transiently and sustained gastrin treated cells. The panels show gene expression time profiles for selected apoptosis-associated genes, differentially expressed in transiently versus sustained gastrin treated cells. Data from two independent microarray experiments are shown as described in the legend to Figure 2B. Casp2: caspase 2; Mcl1: myeloid cell leukemia sequence 1; Itpr1: inositol 1,4,5-trisphosphate receptor, type 1 (synonym: Ip3r1); Selm: selenoprotein M; Clu: clusterin.
Figure 4
Figure 4
Sustained gastrin treatment has an anti-apoptotic effect involving PKC-dependent mechanisms. Apoptosis was induced in AR42J cells by serum starvation for 72 h and measured using Caspase Glo 3/7 assay. A: Caspase activity in cells treated with gastrin. B: Caspase activity in untreated (U), sustained (S) or transiently (T) gastrin treated cells. C-D: Caspase activity in cells pretreated with inhibitors of PI3K (LY) or PKC (GF) before cultivating in the absence (U) or presence of gastrin in a sustained mode (S). The data were normalized to the median intensity of untreated cells in each independent experiment, and is shown as mean relative caspase 3/7 activity of three independent experiments (6 technical replicates in each independent experiment). Error bars represent 95% CI. * Bonferroni-adjusted p-value < 0.05; significant difference from untreated cells with or without inhibitor.
Figure 5
Figure 5
Temporal expression profiles of early, delayed and late gastrin-induced genes. A subset of 181 markedly gastrin-induced genes with differing expression patterns in transient versus sustained mode were used to further characterize the temporal profiles. The data were extracted from the independent time series microarray experiment where sustained gastrin treated cells were harvested at 10 different time points between 15 min and 14 h. The samples from untreated control cells were harvested at time zero and throughout the time course (11 time points). These genes were grouped by time profiles and peak expression (based on mean fold induction of sustained versus untreated cells at the same time point, N=2) into 6 groups as illustrated in the heat map and panel a-f. See details in the main text.
Figure 6
Figure 6
Time profiles for selected early (A), delayed (B) and late (C) genes differentially expressed in transiently versus sustained gastrin treated cells. The panels show data from three independent time series microarray experiments. Left panels: mRNA expression level (normalized log2-transformed signal intensities) for untreated (open dots) and sustained gastrin treated (black dots) cells. Experimental protocol is described in the legend to Figure 2B. Middle panels: Gastrin induced gene expression in transiently (grey lines) and sustained (black lines) treated cells. The data is shown as mean fold induction relative to untreated cells at the same time point (N=2; see Figure 1A for details). Right panels: The effect of sustained gastrin treatment was measured in the presence (grey lines) and absence (black lines) of cycloheximide (CHX). The data is shown as mean fold induction relative to either untreated cells (gastrin versus untreated) or relative to CHX treated cells (gastrin and CHX versus CHX) at the same time point (1-10 h). The early primary genes c-Fos and Junb as well as the delayed primary gene Hdac5 are super-induced in the presence of CHX. Thus, these genes are probably repressed by other gastrin-induced repressors dependent on de novo protein synthesis [37]. The late gene Maged2 is a primary gene. The delayed gene Vegfa and the late genes Prss1 and Prss3 (LOC362347) are secondary. Hdac5 is a co-transcription factor involved in histone modification and shown to control cell-cycle progression and survival of human cancer cells [45]. VEGFA acts on endothelial cells and has various effects, including mediating increased vascular permeability, inducing angiogenesis and cell growth, promoting cell migration, and inhibiting apoptosis [46]. Maged2 has been classified as a co-transcription factor and are found elevated in e.g., goblet cell adenocarcinoids compared to normal mucosa [47]. Prss1 and Prss3 are discussed in the main text.
Figure 7
Figure 7
Prolonged activation of ERK1/2 and expression of JUNB are dependent on sustained gastrin treatment. Sustained and transiently gastrin treated cells were grown and harvested as described in Material and Methods. A-B: Activation of ERK (A) and AKT (B) were analysed at the indicated time points; starting 15 min after gastrin was removed in the transient protocol. Western Blot images of phospho-ERK1/2, total ERK1/2, phospho-AKT and total AKT in untreated (U), sustained (S) and transiently (T) gastrin treated cells. T0: time point zero. Results show one representative of three independent experiments. C: The duration and magnitude of mRNA expression of the AP-1 component Junb were measured by qRT-PCR analysis in cells treated by gastrin in a sustained or transient mode relative to untreated controls at time point zero in one representative experiment (mean fold induction +/− SD of three technical replicates). D: Western Blot image of JUNB protein in whole cell lysate at T0 and 4, 6 and 8 h of untreated (U), sustained (S) and transiently (T) treated cells. Result show one representative of three independent experiments.
Figure 8
Figure 8
JUNB is involved in sustained gastrin induced expression of ER stress/UPR related genes. Cells with JUNB knocked down (JUNB KD) and control cells (Firefly KD) were harvested at indicated time points after sustained gastrin treatment, and mRNA expression level for selected genes were measured by qRT-PCR analysis. Results show fold induction of gastrin treated cells relative to untreated control cells (mean +/− SD of three technical replicates). The mRNA expression level of Atf4 was 57% lower in JUNB KD cells compared to control cells at 4 h. Herpud1 mRNA levels were ~30% lower in JUNB KD cells at 1, 2 and 4 h, while Chac1 was repressed 58% and 45% at 2 and 4 h, respectively when JUNB was knocked down. Figures represent one of two independent experiments.

References

    1. Miller-Jensen K, Janes KA, Brugge JS, Lauffenburger DA. Common effector processing mediates cell-specific responses to stimuli. Nature. 2007;448(7153):604–608. doi: 10.1038/nature06001. - DOI - PubMed
    1. Glauser DA, Schlegel W. Mechanisms of transcriptional regulation underlying temporal integration of signals. Nucleic Acids Res. 2006;34(18):5175–5183. doi: 10.1093/nar/gkl654. - DOI - PMC - PubMed
    1. Glauser DA, Schlegel W. Sequential actions of ERK1/2 on the AP-1 transcription factor allow temporal integration of metabolic signals in pancreatic beta cells. FASEB J. 2007;21(12):3240–3249. doi: 10.1096/fj.06-7798com. - DOI - PubMed
    1. Zi Z, Feng Z, Chapnick DA, Dahl M, Deng D, Klipp E, Moustakas A, Liu X. Quantitative analysis of transient and sustained transforming growth factor-beta signaling dynamics. Mol Syst Biol. 2011;7:492. - PMC - PubMed
    1. Hao S, Baltimore D. The stability of mRNA influences the temporal order of the induction of genes encoding inflammatory molecules. Nature immunology. 2009;10(3):281–288. doi: 10.1038/ni.1699. - DOI - PMC - PubMed

Publication types

MeSH terms