

Genomic clustering and co-regulation of transcriptional networks in the pathogenic fungus Fusarium graminearum
- PMID: 23805903
- PMCID: PMC3703260
- DOI: 10.1186/1752-0509-7-52
Genomic clustering and co-regulation of transcriptional networks in the pathogenic fungus Fusarium graminearum
Abstract
Background: Genes for the production of a broad range of fungal secondary metabolites are frequently colinear. The prevalence of such gene clusters was systematically examined across the genome of the cereal pathogen Fusarium graminearum. The topological structure of transcriptional networks was also examined to investigate control mechanisms for mycotoxin biosynthesis and other processes.
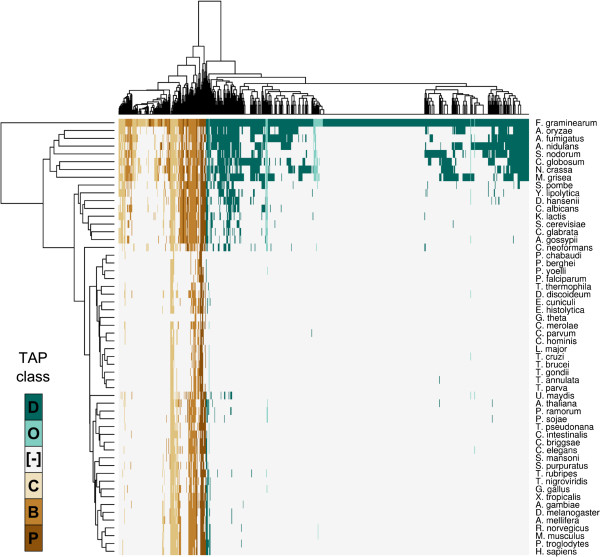
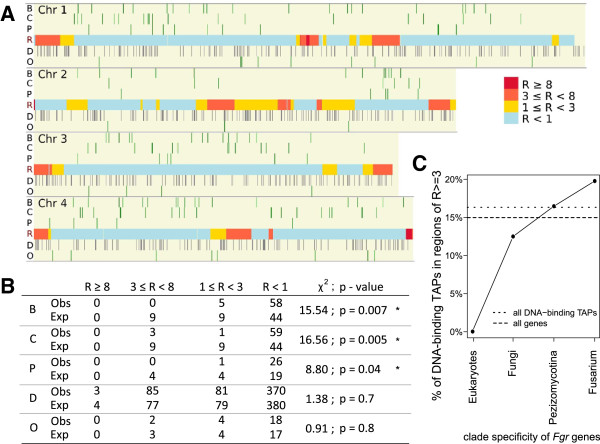
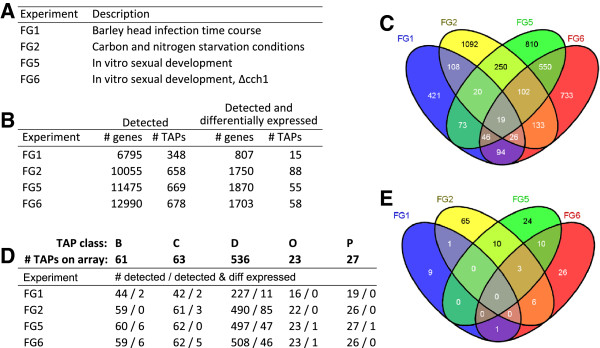
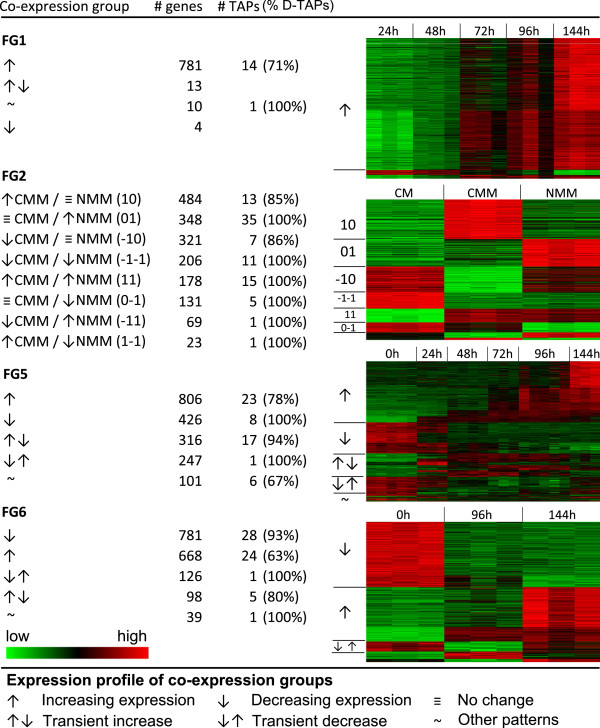
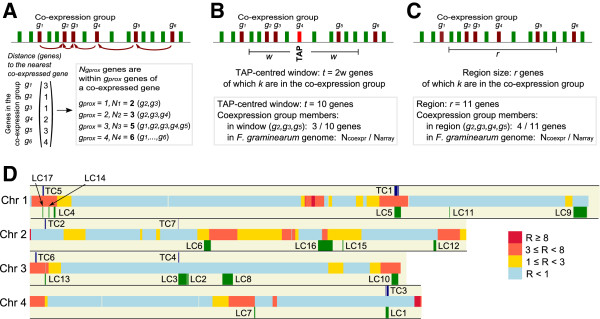
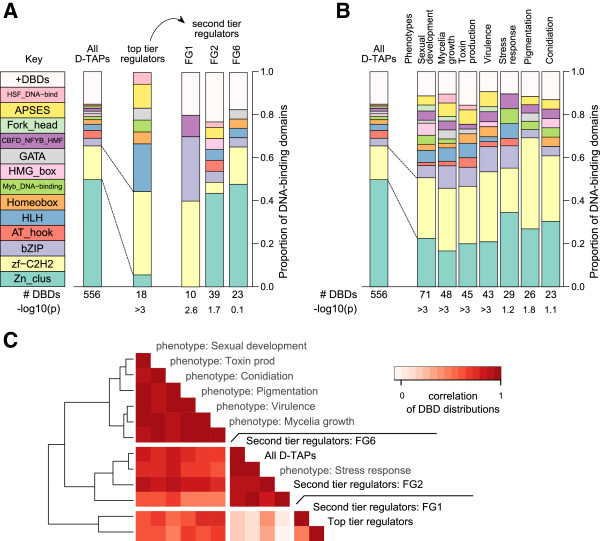
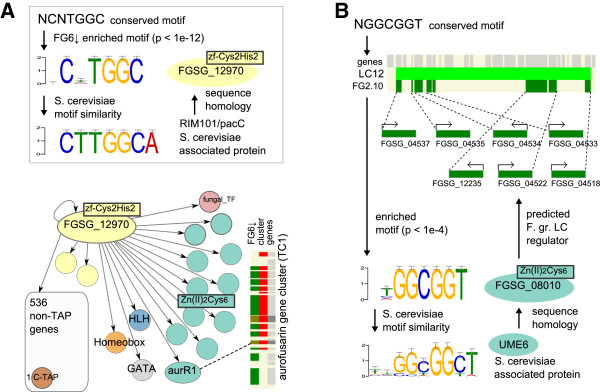
Results: The genes associated with transcriptional processes were identified, and the genomic location of transcription-associated proteins (TAPs) analyzed in conjunction with the locations of genes exhibiting similar expression patterns. Highly conserved TAPs reside in regions of chromosomes with very low or no recombination, contrasting with putative regulator genes. Co-expression group profiles were used to define positionally clustered genes and a number of members of these clusters encode proteins participating in secondary metabolism. Gene expression profiles suggest there is an abundance of condition-specific transcriptional regulation. Analysis of the promoter regions of co-expressed genes showed enrichment for conserved DNA-sequence motifs. Potential global transcription factors recognising these motifs contain distinct sets of DNA-binding domains (DBDs) from those present in local regulators.
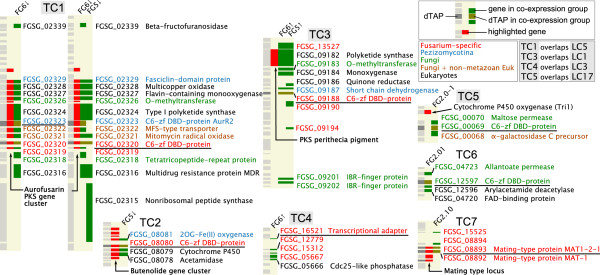
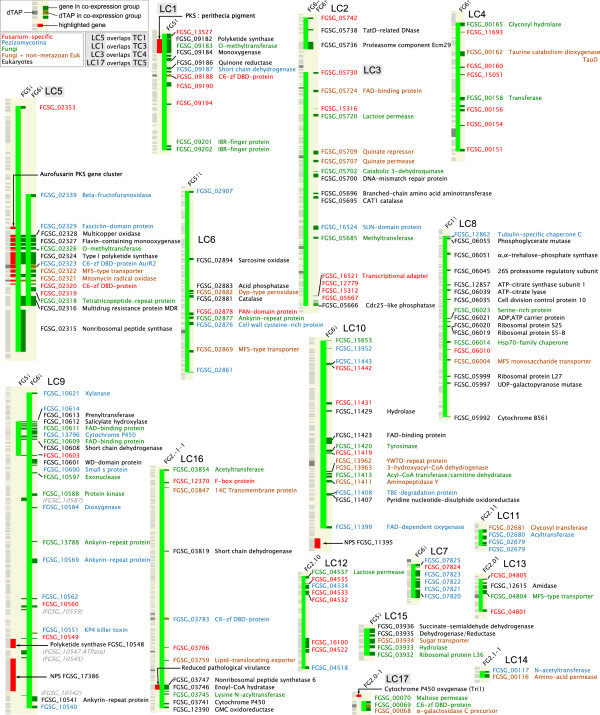
Conclusions: Proteins associated with basal transcriptional functions are encoded by genes enriched in regions of the genome with low recombination. Systematic searches revealed dispersed and compact clusters of co-expressed genes, often containing a transcription factor, and typically containing genes involved in biosynthetic pathways. Transcriptional networks exhibit a layered structure in which the position in the hierarchy of a regulator is closely linked to the DBD structural class.
Figures
Similar articles
-
The Fusarium graminearum genome reveals more secondary metabolite gene clusters and hints of horizontal gene transfer.PLoS One. 2014 Oct 15;9(10):e110311. doi: 10.1371/journal.pone.0110311. eCollection 2014. PLoS One. 2014. PMID: 25333987 Free PMC article.
-
Dynamic network inference and association computation discover gene modules regulating virulence, mycotoxin and sexual reproduction in Fusarium graminearum.BMC Genomics. 2020 Feb 24;21(1):179. doi: 10.1186/s12864-020-6596-y. BMC Genomics. 2020. PMID: 32093656 Free PMC article.
-
Heterologous expression of intact biosynthetic gene clusters in Fusarium graminearum.Fungal Genet Biol. 2019 Nov;132:103248. doi: 10.1016/j.fgb.2019.103248. Epub 2019 Jul 4. Fungal Genet Biol. 2019. PMID: 31279974
-
Secondary metabolism in Fusarium fujikuroi: strategies to unravel the function of biosynthetic pathways.Appl Microbiol Biotechnol. 2018 Jan;102(2):615-630. doi: 10.1007/s00253-017-8679-5. Epub 2017 Dec 4. Appl Microbiol Biotechnol. 2018. PMID: 29204899 Review.
-
Molecular biology of Fusarium mycotoxins.Int J Food Microbiol. 2007 Oct 20;119(1-2):47-50. doi: 10.1016/j.ijfoodmicro.2007.07.024. Epub 2007 Jul 31. Int J Food Microbiol. 2007. PMID: 17707105 Review.
Cited by
-
Condition-dependent co-regulation of genomic clusters of virulence factors in the grapevine trunk pathogen Neofusicoccum parvum.Mol Plant Pathol. 2018 Jan;19(1):21-34. doi: 10.1111/mpp.12491. Epub 2016 Dec 4. Mol Plant Pathol. 2018. PMID: 27608421 Free PMC article.
-
Trends in biological data integration for the selection of enzymes and transcription factors related to cellulose and hemicellulose degradation in fungi.3 Biotech. 2021 Nov;11(11):475. doi: 10.1007/s13205-021-03032-y. Epub 2021 Oct 26. 3 Biotech. 2021. PMID: 34777932 Free PMC article. Review.
-
The Fusarium graminearum genome reveals more secondary metabolite gene clusters and hints of horizontal gene transfer.PLoS One. 2014 Oct 15;9(10):e110311. doi: 10.1371/journal.pone.0110311. eCollection 2014. PLoS One. 2014. PMID: 25333987 Free PMC article.
-
Recombination suppression and evolutionary strata around mating-type loci in fungi: documenting patterns and understanding evolutionary and mechanistic causes.New Phytol. 2021 Mar;229(5):2470-2491. doi: 10.1111/nph.17039. Epub 2020 Dec 1. New Phytol. 2021. PMID: 33113229 Free PMC article. Review.
-
Comprehensive Description of Fusarium graminearum Pigments and Related Compounds.Foods. 2018 Oct 5;7(10):165. doi: 10.3390/foods7100165. Foods. 2018. PMID: 30301164 Free PMC article. Review.
References
-
- Hurst LD, Pal C, Lercher MJ. The evolutionary dynamics of eukaryotic gene order. Nat Rev Genet. 2004;5:299–310. - PubMed
Publication types
MeSH terms
Substances
Grants and funding
LinkOut - more resources
Full Text Sources
Other Literature Sources
