. 2013 Jun 28:10:214.
doi: 10.1186/1743-422X-10-214.

Inhibition of hepatitis B virus (HBV) gene expression and replication by HBx gene silencing in a hydrodynamic injection mouse model with a new clone of HBV genotype B

Affiliations

Inhibition of hepatitis B virus (HBV) gene expression and replication by HBx gene silencing in a hydrodynamic injection mouse model with a new clone of HBV genotype B

Lei Li et al. Virol J. .

Abstract

Background: It has been suggested that different hepatitis B virus (HBV) genotypes may have distinct virological characteristics that correlate with clinical outcomes during antiviral therapy and the natural course of infection. Hydrodynamic injection (HI) of HBV in the mouse model is a useful tool for study of HBV replication in vivo. However, only HBV genotype A has been used for studies with HI.

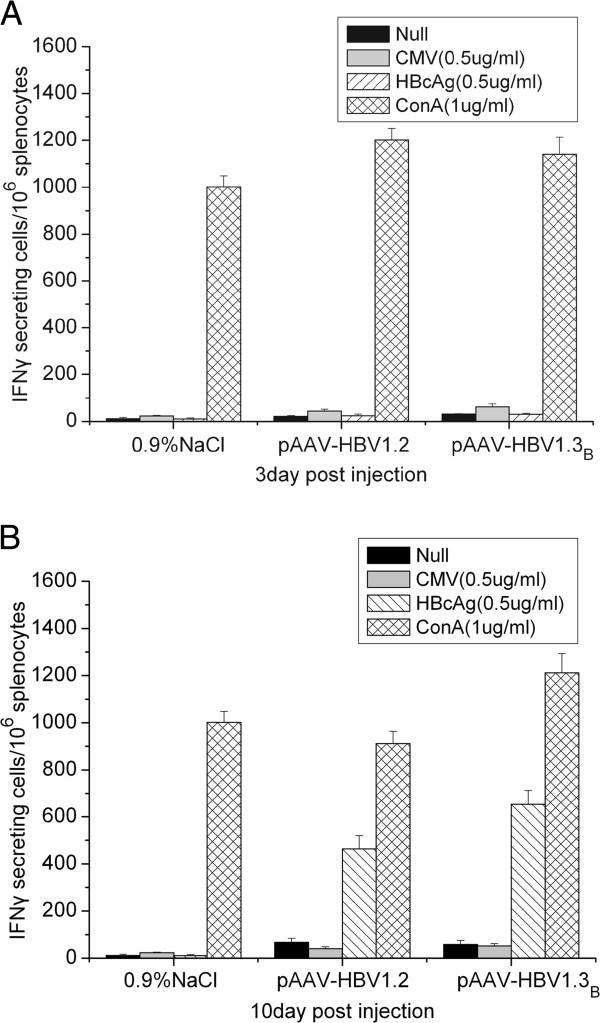
Methods: We constructed 3 replication-competent clones containing 1.1, 1.2 and 1.3 fold overlength of a HBV genotype B genome and tested them both in vitro and in vivo. Moreover, A HBV genotype B clone based on the pAAV-MCS vector was constructed with the 1.3 fold HBV genome, resulting in the plasmid pAAV-HBV1.3B and tested by HI in C57BL/6 mice. Application of siRNA against HBx gene was tested in HBV genotype B HI mouse model.

Results: The 1.3 fold HBV clone showed higher replication and gene expression than the 1.1 and 1.2 fold HBV clones. Compared with pAAV-HBV1.2 (genotype A), the mice HI with pAAV-HBV1.3B showed higher HBsAg and HBeAg expression as well as HBV DNA replication level but a higher clearance rate. Application of two plasmids pSB-HBxi285 and pSR-HBxi285 expressing a small/short interfering RNA (siRNA) to the HBx gene in HBV genotype B HI mouse model, leading to an inhibition of HBV gene expression and replication. However, HBV gene expression may resume in some mice despite an initial delay, suggesting that transient suppression of HBV replication by siRNA may be insufficient to prevent viral spread, particularly if the gene silencing is not highly effective.

Conclusions: Taken together, the HI mouse model with a HBV genotype B genome was successfully established and showed different characteristics in vivo compared with the genotype A genome. The effectiveness of gene silencing against HBx gene determines whether HBV replication may be sustainably inhibited by siRNA in vivo.


Figures

Figure 1
Figure 1
Comparison of the in vitro and in vivo replication competence of pBS-HBV1. 1B, pBS-HBV1.2B and pBS-HBV1.3B. 0.8 μg of plasmid DNA were transfected into Huh-7 cells which were seeded in 24-well plates at approximately 60% confluence and 10 μg of plasmid DNA were injected into the tail veins of BALB/c mice. Each group included 10 mice. (A) Titers of HBsAg (ng/ml) and HBeAg (NCU/ml, National Clinical Unit/ml,) in the supernatants of pBS-HBV1.1B, pBS-HBV1.2B and pBS-HBV1.3B transfected Huh-7 cells at 48 h post-transfection. The data were analyzed by one-way ANOVA, and the differences were statistically significant (* and Δ mean p < 0.01). (B) Real-time PCR detection of HBV DNA in mouse sera at day 7 after HI of pBS-HBV1.1B, pBS-HBV1.2B and pBS-HBV1.3B (the number of the mice ≥ 3). The data were analyzed by one-way ANOVA, and the differences were statistically significant (* means p < 0.01). (C) Immunohistochemical staining of the liver sections for HBcAg in hepatocytes of pBS-HBV1.1B- (1), pBS-HBV1.2B- (2), pBS-HBV1.3B- (3) and pBS (4)-injected mice at 7 day post injection (Original magnification: 200X).
Figure 2
Figure 2
HBV replication and gene expression in vivo after HI with pAAV-HBV1.3B or pAAV-HBV1.2. 10 μg of pAAV-HBV1.3B or pAAV-HBV1.2 were injected into the tail veins of C57BL/6 mice. pAAV-HBV1.3B group included 14 mice and pAAV-HBV1.2 group included 9 mice. (A) Real-time detection of HBV DNA in mouse sera at the indicated time points (the number of the mice ≥ 3). (B) Southern blot analysis with 20 mg of total DNA extracted from liver tissues of the mice HI with pAAV-HBV1.3B or pAAV-HBV1.2 at different time points after HI. All DNA samples were treated with RNase before subjected to agarose gel electrophoresis. Bands corresponding to the expected size of the input HBV plasmids, relaxed circular (RC) and single-stranded (SS) HBV DNAs are indicated. (C) Real-time PCR detection of HBV DNA levels in the liver of the mice after HI. (D) Immunohistochemical staining of the liver sections for HBcAg in hepatocytes of HBsAg-positive or HBsAg-negative mice at day 252 after HI with pAAV-HBV1.3B (1, HBsAg positive mice and 3, HBsAg negative mice) and at day 340 after HI with pAAV-HBV1.2 (2, HBsAg positive mice and 4, HBsAg negative mice) (Original magnification: 400X).
Figure 3
Figure 3
HBV persistence after HI in mouse in dependence on the mouse genetic backgrounds and the vector backbones. 10 μg of pBS-HBV1.3B or pAAV-HBV1.3B were injected into the tail veins of BALB/c or C57BL/6 mice. Each group included 5 mice. In addition, 10 μg pAAV-HBV1.3B or pAAV-HBV1.2 were injected into the tail veins of C57BL/6 mice to test the ability of these two plasmids to establish persistent HBV replication. pAAV-HBV1.3B group included 14 mice and pAAV-HBV1.2 group included 9 mice. (A) The positive rate for serum HBsAg in C57BL/6 or BALB/c mice receiving pBS-HBV1.3B or pAAV-HBV1.3B injections at indicated time points after injection. The data were analyzed by Kaplan–Meier analysis, and the differences between each group were statistically significant (p = 0.004, <0.05). (B) The positive rate for serum HBsAg in C57BL/6 mice receiving pAAV-HBV1.3B or pAAV-HBV1.2 injection. The data were analyzed by Kaplan–Meier analysis, and the differences between two groups were statistically significant (p = 0.017, <0.05). The cutoff value for determining HBsAg-positivity was 0.1.
Figure 4
Figure 4
Specific T-cell responses to HBcAg epitopes in mice after HI. The specific T-cell responses to the full length HBcAg peptide after HI. The number of HBcAg specific IFNγ secreting cells in 1× 10⁶ splenocytes in pAAV-HBV1.2 and pAAV-HBV1.3B injected mice at 3dpi (A) and 10dpi (B) by IFNγ ELISPOT assay in the presence of 0.5 μg/ml full length HBcAg peptide. The experiments were done in duplicate. The data were analyzed by t test, and there is no significant differences between those two groups (p > 0.05).
Figure 5
Figure 5
The effect of HBx iRNA on HBV gene expression and replication in vitro. Different concentrations of HBx iRNA and pAAV-HBV1.3B were co-transfected into Huh-7 cells which were seeded in 24-well plates at approximately 60% confluence. The concentrations of the plasmids were indicated in the Tables. (A) HBsAg and HBeAg levels in the cell culture supernatants of cells co-transfected with 0.5 μg of pAAV-HBV1.3B- and 0.5 μg of pSR-HBxi314- or pSR-HBxi285. (B) HBsAg and HBeAg levels in the cell culture supernatants of cells co-transfected with pAAV-HBV1.3B and 0, 0.1, 0.3, or 0.5 μg of pSR-HBxi285. (C) HBV replicative intermediates in Huh-7 cells transfected with pAAV-HBV1.3B and 0, 0.1, 0.3, or 0.5 μg of pSR-HBxi285. (D) A comparison of the inhibition rate of HBsAg in the cell culture supernatants of cells co-transfected with pAAV-HBV1.3B- and pSB-HBxi285- or pSR-HBxi285.
Figure 6
Figure 6
The effect of HBxi285 on HBV gene expression and replication in vivo. 10 μg pAAV-HBV1.3B and 10 μg pSB-HBxi285, pSR-HBxi285 or control plasmids were co-injected into the tail veins of C57BL/6 mice. Each group included 10 mice. (A) HBsAg levels, (B) HBV DNA and (C) the positive rate of HBsAg in the serum of C57BL/6 mice treated with pAAV-HBV1.3B and pSR-HBxi285 or pSB-HBxi285. Value 0 of HBV DNA means the copy number of HBV DNA is lower than detection limit. The data were analyzed by one-way ANOVA, and the differences were statistically significant (# : p < 0.05 pSR-HBxi285 group vs. pSR-HBxicon group; * : p < 0.05 pSR-HBxi285 group vs. pSB-HBxi285 group by one-way ANOVA) (D) Immunohistochemical staining for HBcAg in hepatocytes of C57BL/6 mice treated with pSR-HBxi285, pSB-HBxi285, pSR-HBxicon or pSR vector separately at 3 day post injection (1–4) and C57BL/6 mice treated with pSR-HBxi285 or pSR-HBxicon in the 4th wpi (5–6) (Original magnification: 200X).

Similar articles

Cited by

References

    1. Lai CL, Ratziu V, Yuen MF, Poynard T. Viral hepatitis B. Lancet. 2003;10:2089–2094. doi: 10.1016/S0140-6736(03)15108-2. - DOI - PubMed
    1. Ganem D, Prince AM. Hepatitis B virus infection—natural history and clinical consequences. N Engl J Med. 2004;10:1118–1129. doi: 10.1056/NEJMra031087. - DOI - PubMed
    1. Liaw YF, Chu CM. Hepatitis B virus infection. Lancet. 2009;10:582–592. doi: 10.1016/S0140-6736(09)60207-5. - DOI - PubMed
    1. Kao JH. Molecular epidemiology of hepatitis B virus. Korean J Intern Med. 2011;10:255–261. doi: 10.3904/kjim.2011.26.3.255. - DOI - PMC - PubMed
    1. Guidotti LG, Matzke B, Schaller H, Chisari FV. High level hepatitis B virus replication in transgenic mice. J Virol. 1995;10:6158–6169. - PMC - PubMed

Publication types

Substances