

Immunomodulatory activity of polysaccharides isolated from Clerodendrum splendens: beneficial effects in experimental autoimmune encephalomyelitis
- PMID: 23806004
- PMCID: PMC3717075
- DOI: 10.1186/1472-6882-13-149
Immunomodulatory activity of polysaccharides isolated from Clerodendrum splendens: beneficial effects in experimental autoimmune encephalomyelitis
Abstract
Background: Extracts of leaves from Clerodendrum have been used for centuries to treat a variety of medicinal problems in tropical Africa. However, little is known about the high-molecular weight active components conferring therapeutic properties to these extracts.
Methods: Polysaccharides from the leaves of Clerodendrum splendens were extracted and fractionated by ion exchange and size-exclusion chromatography. Molecular weight determination, sugar analysis, degree of methyl esterification, and other chemical characterization of the fractions were performed. Immunomodulatory activity of the fractions was evaluated by determining their ability to induce monocyte/macrophage nitric oxide (NO), cytokine production, and mitogen-activated protein kinase (MAPK) phosphorylation. Experimental autoimmune encephalomyelitis (EAE) was induced in C57BL/6 mice, and severity of EAE was monitored in mice treated with intraperitoneal (i.p.) injections of the most active polysaccharide fraction. Lymph nodes (LN) and spleen were harvested, and levels of cytokines in supernatants from LN cells and splenocytes challenged with myelin oligodendrocyte glycoprotein peptide were determined.
Results: Fractions containing type II arabinogalactan had potent immunomodulatory activity. Specifically, the high-molecular weight sub-fraction CSP-AU1 (average of 38.5 kDa) induced NO and cytokine [interleukin (IL)-1α, -1β, -6, -10, tumor necrosis factor (TNF; designated previously as TNF-α), and granulocyte macrophage-colony stimulating factor (GM-CSF)] production by human peripheral blood mononuclear cells (PBMCs) and monocyte/macrophages. CSP-AU1-induced secretion of TNF was prevented by Toll-like receptor 4 (TLR4) antagonist LPS-RS, indicating a role for TLR4 signaling. Treatment with CSP-AU1 also induced phosphorylation of a number of MAPKs in human PBMC and activated AP-1/NF-κB. In vivo treatment of mice with CSP-AU1 and CSP-NU1 resulted in increased serum IL-6, IL-10, TNF, monocyte chemoattractant protein-1 (MCP-1), macrophage inflammatory protein (MIP)-1α/CCL3, and MIP-1β/CCL4. CSP-AU1 treatment of mice with EAE (50 mg/kg, i.p., daily, 13 days) resulted in significantly reduced disease severity in this experimental model of multiple sclerosis. Levels of IL-13, TNF, interferon (IFN)-γ, IL-17, and GM-CSF were also significantly decreased, whereas transforming growth factor (TGF)-β was increased in LN cells from CSP-AU1-treated EAE mice.
Conclusions: Polysaccharide CSP-AU1 is a potent natural innate immunomodulator with a broad spectrum of agonist activity in vitro and immunosupressive properties after chronic administration in vivo.
Figures

 , panel A). Values are the mean ± S.D. of triplicate samples from one experiment, which is representative of two independent experiments. Statistically significant differences (* p<0.05) between PBS-treated cells and cells treated with polysaccharide fractions or LPS are indicated.
 , panels A, D, and G). Cell-free supernatants were collected, and extracellular TNF was quantified by ELISA. Values are the mean ± S.D. of triplicate samples from one experiment, which is representative of three independent experiments. Statistically significant differences (* p<0.05) between PBS-treated cells and cells treated with polysaccharide fractions or LPS are indicated.
 , panel A). Cell-free supernatants were collected, and extracellular IL-6 was quantified by ELISA. Values are the mean ± S.D. of triplicate samples from one experiment, which is representative of three independent experiments. Statistically significant differences (* p<0.05) between PBS-treated cells and cells treated with polysaccharide fractions or LPS are indicated.
 , panels A and D). Cell-free supernatants were collected, and extracellular TNF was quantified by ELISA. Values are the mean ± S.D. of triplicate samples from one experiment, which is representative of three independent experiments. Statistically significant differences (* p<0.05) between PBS-treated cells and cells treated with polysaccharide fractions or LPS are indicated.
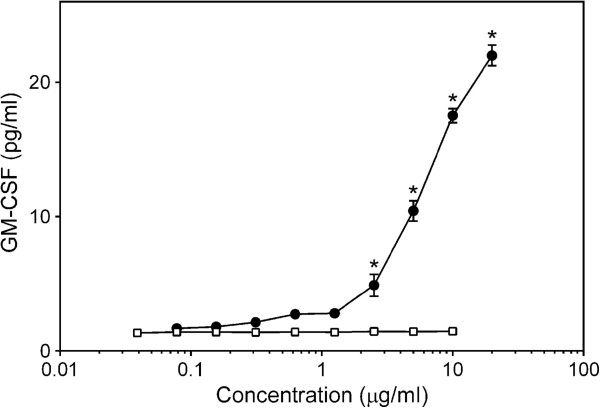


 , panel A). Alkaline phosphatase activity was analyzed spectrophotometrically (absorbance at 655 nm) in the cell supernatants, as described. Values are the mean ± S.D. of triplicate samples from one experiment, which is representative of two independent experiments. Statistically significant differences (* p<0.05) between PBS-treated cells and cells treated with polysaccharide fractions or LPS are indicated.


References
-
- Shrivastava N, Patel T. Clerodendrum and healthcare: an overview. Medicinal Aromatic Plant Sci Biotech. 2007;1:140–150.
-
- Irvine FR. Woody Plants of Ghana. 1. London: Oxford University Press; 1961. pp. 750–754.
Publication types
MeSH terms
Substances
Grants and funding
LinkOut - more resources
Full Text Sources
Other Literature Sources
Research Materials
Miscellaneous
