Central corneal thickness does not correlate with TonoLab-measured IOP in several mouse strains with single transgenic mutations of matricellular proteins
- PMID: 23806329
- PMCID: PMC3795815
- DOI: 10.1016/j.exer.2013.06.017
Central corneal thickness does not correlate with TonoLab-measured IOP in several mouse strains with single transgenic mutations of matricellular proteins
Abstract
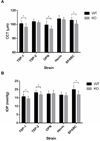
Accurate and reliable measurement of intraocular pressure (IOP) is crucial in the study of glaucoma using the mouse model. The purpose of this study was to determine the relationship between TonoLab-measured IOP and central corneal thickness (CCT) in mouse strains with single gene mutations of matricellular proteins. Wild-type (WT) and transgenic mouse strains with single gene mutations (KO) of thrombospondin-1 (TSP-1), thrombospondin-2 (TSP-2), osteopontin (OPN), hevin, and secreted protein acidic rich in cysteine (SPARC) were imaged at six weeks using optical coherence tomography (Stratus, Zeiss) to determine CCT. IOP was measured between 11am and 3pm using TonoLab, one week later. For all measurements, mice were anesthetized using intraperitoneal injection ketamine:xylazine. CCT and IOP were measured in 583 mice (TSP-1 n = 71 and 41, TSP-2 n = 60 and 32, OPN n = 81 and 50, hevin n = 59 and 76, SPARC n = 54 and 59, WT and KO, respectively). Mean CCT was 5-6% lower in three KO strains-TSP-1, OPN, and SPARC-compared to their corresponding WT (p = 1.55 × 10(-7), 1.63 × 10(-11), and 1.91 × 10(-7), respectively). The mean IOP was 8.3%, 6.6%, and 15.1% lower in three KO strains-TSP-1, TSP-2, and SPARC-compared to corresponding WT (p = 2.11 × 10(-5), 2.93 × 10(-3), and 3.76 × 10(-9), respectively. Linear regression of IOP versus CCT yielded no statistically significant within-strain correlations for TSP-1 (p = 0.12 and 0.073), TSP-2 (p = 0.473 and 0.92), OPN (p = 0.212 and 0.916), Hevin (p = 0.746 and 0.257), and SPARC (p = 0.080 and 0.056), reported as p-values considering a null hypothesis of zero slope (WT and KO, respectively). Neither C57-derived strains (TSP-1 and OPN) nor 129-derived strains (TSP-2, hevin, SPARC) demonstrated a correlation between mean IOP and mean CCT across different strains (p = 0.75 and p = 0.53, respectively). Taken together, these results indicate that CCT is not required to interpret TonoLab IOP readings in the mice when CCT varies 10% about the mean. This does not exclude the possibility of an IOP-CCT correlation for CCT values outside this range or for inter-strain comparisons where the mean CCT differs more than 10%.
Keywords: TonoLab; central corneal thickness; glaucoma; intraocular pressure; rebound tonometry; trabecular meshwork; transgenic mice.
Copyright © 2013 Elsevier Ltd. All rights reserved.
Conflict of interest statement
The authors report no conflicts of interest. The authors alone are responsible for the content and writing of the paper.
Figures


References
-
- Aihara M, Lindsey JD, Weinreb RN. Twenty-four-hour pattern of mouse intraocular pressure. Exp. Eye Res. 2003;77:681–686. - PubMed
-
- Bhan A, Browning AC, Shah S, Hamilton R, Dave D, Dua HS. Effect of corneal thickness on intraocular pressure measurements with the pneumotonometer, Goldmann applanation tonometer, and Tono-Pen. Invest. Ophthalmol. Vis. Sci. 2002;43:1389–1392. - PubMed
Publication types
MeSH terms
Substances
Grants and funding
LinkOut - more resources
Full Text Sources
Other Literature Sources
Molecular Biology Databases
Research Materials
Miscellaneous

