. 2013 Jun;37(4):293-303.
doi: 10.1016/j.compmedimag.2013.05.004. Epub 2013 Jun 24.

SR-NLM: a sinogram restoration induced non-local means image filtering for low-dose computed tomography

Affiliations

SR-NLM: a sinogram restoration induced non-local means image filtering for low-dose computed tomography

Zhaoying Bian et al. Comput Med Imaging Graph. 2013 Jun.

Abstract

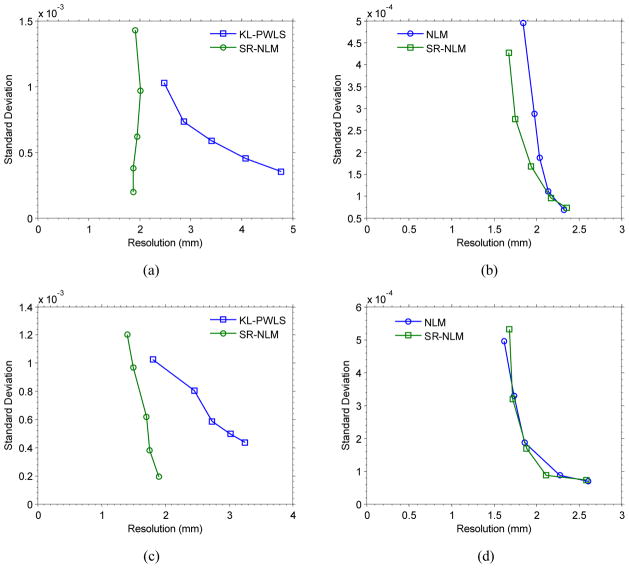
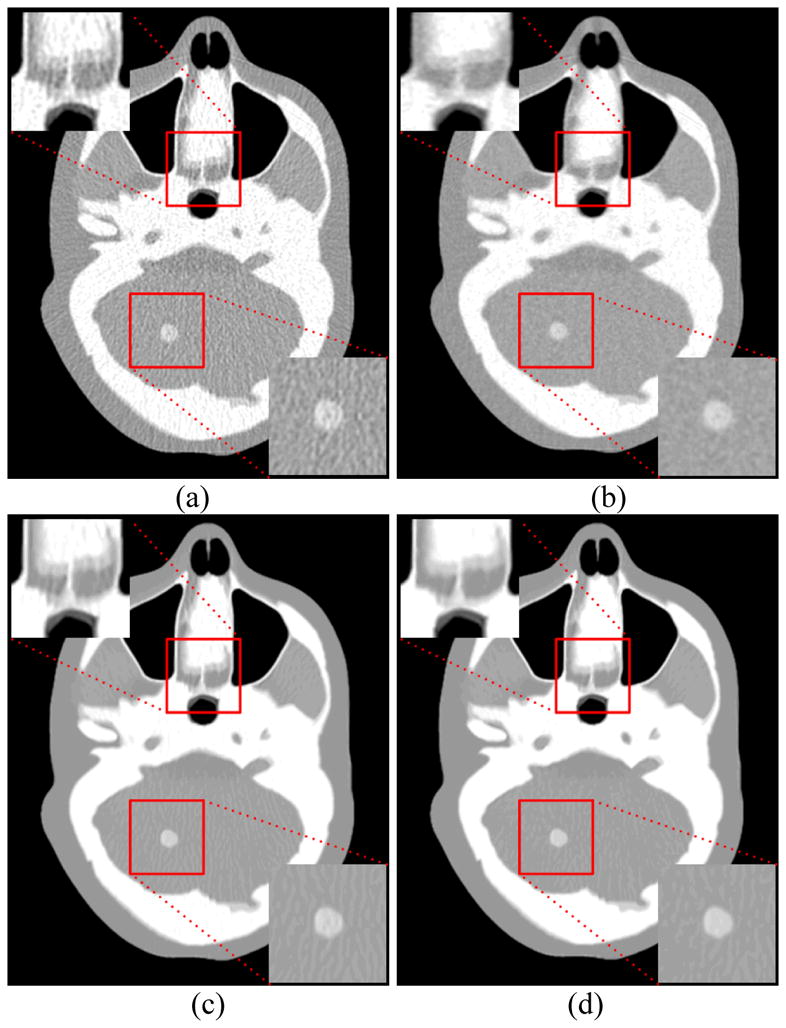
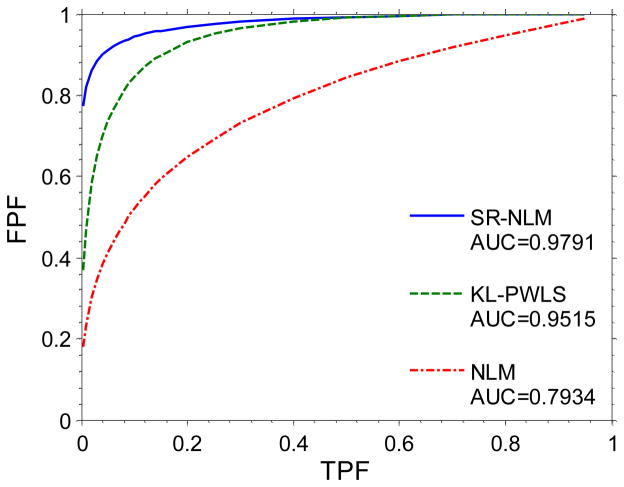
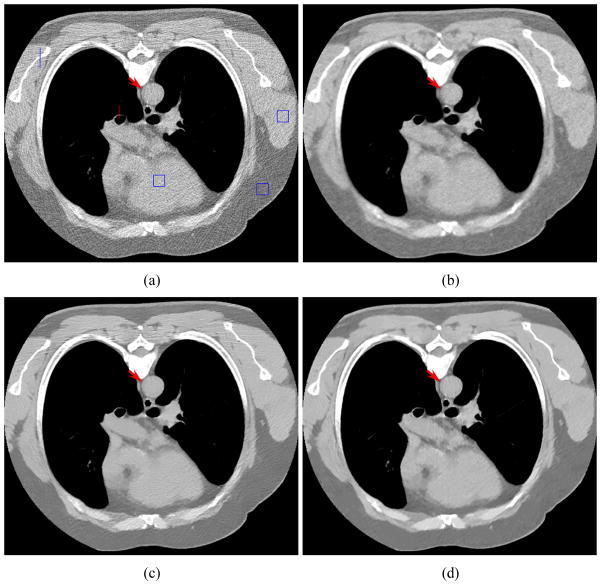
Radiation dose has raised significant concerns to patients and operators in modern X-ray computed tomography (CT) examinations. A simple and cost-effective means to perform a low-dose CT scan is to lower the milliampere-seconds (mAs) as low as reasonably achievable in data acquisition. However, the associated image quality with lower-mAs scans (or low-dose scans) will be unavoidably degraded due to the excessive data noise, if no adequate noise control is applied during image reconstruction. For image reconstruction with low-dose scans, sinogram restoration algorithms based on modeling the noise properties of measurement can produce an image with noise-induced artifact suppression, but they often suffer noticeable resolution loss. As an alternative technique, the noise-reduction algorithms via edge-preserving image filtering can yield an image without noticeable resolution loss, but they often do not completely eliminate the noise-induced artifacts. With above observations, in this paper, we present a sinogram restoration induced non-local means (SR-NLM) image filtering algorithm to retain the CT image quality by fully considering the advantages of the sinogram restoration and image filtering algorithms in low-dose image reconstruction. Extensive experimental results show that the present SR-NLM algorithm outperforms the existing methods in terms of cross profile, noise reduction, contrast-to-ratio measure, noise-resolution tradeoff and receiver operating characteristic (ROC) curves.

Keywords: CT; Image filtering; Low-dose; Non-local means; Sinogram restoration.


Conflict of interest statement

Conflicts of interest statement

No conflicts of interest were declared by the authors.

Figures

Figure 1
Figure 1
Three digital phantoms used for computer simulation studies. (a) the modified clock phantom contains eight inserts with varying contrast (C1: +30%, C2: −7%, C3: −15%, C4: +85%, C5: −30%, C6: +7%, C7: +15%, and C8: −85%). Eight ROIs marked by larger squares allow comparison of zoomed images. ROI 1, ROI 2 and background region indicated by small squares allow comparison of the contrast-to-noise ratio. The lines along the edges of the inserts (C1 and C4) allow comparison of the noise-resolution tradeoff; (b) the image of one slice of XCAT phantom with a lesion (contrast of +15%) as indicated by a square. Two ROIs marked by two squares allow visual inspection comparison of zoomed images; and (c) the modified Shepp-logan phantom with a low-contrast small lesion (contrast of +1.5%) as indicated by the blue arrow.
Figure 2
Figure 2
The clock phantom images reconstructed by different methods and eight zoomed regions indicated by the marks with C1 to C8 in figure 1(a). (a) the conventional FBP image with ramp filter reconstructed from the original sinogram data; (b) the standard FBP image reconstructed from the restored sinogram data by the KL-PWLS algorithm with β = 400 ; (c) the conventional FBP image restored by the original NLM algorithm with τ =5.6 ×10⁻³; and (d) the reconstructed FBP image restored by the present SR-NLM algorithm with β = 400, τ =1.4 ×10⁻³. All images are displayed with same window.
Figure 3
Figure 3
The horizontal profiles through the center of bone insert (C4) and the dark insert (C5) in the reconstructed clock phantom images corresponding to figure 2.
Figure 4
Figure 4
The UQIs of eight regions indicated by the squares with the symbol Ci (i=1,2,…,8) in figure 1(a) from the reconstructed images by four different algorithms.
Figure 5
Figure 5
The noise-resolution tradeoff curves. (a) the noise-resolution tradeoff curves of the insert C4 from the KL-PWLS and SR-NLM algorithms; (b) the noise-resolution tradeoff curves of the insert C4 from the NLM and SR-NLM algorithms; (c) the noise-resolution tradeoff curves of the insert C1 from the KL-PWLS and SR-NLM algorithms; and (d) the noise-resolution tradeoff curves of the insert C1 from the NLM and SR-NLM algorithms. The noise-resolution tradeoff curves shown in (a) and (c) were obtained by varying the penalty parameter β from 100 to 1000 and those shown in (b) and (d) were obtained by varying the scalar parameter τ from 5×10⁻⁴ to 1×10⁻².
Figure 6
Figure 6
The XCAT phantom images reconstructed by different methods. (a) the conventional FBP with ramp filter reconstructed image from the original low-dose sinogram data; (b) the standard FBP reconstructed image from the restored low-dose sinogram data by the KL-PWLS algorithm with β = 200 ; (c) the conventional FBP image restored by the original NLM algorithm with τ =1.3 ×10⁻² ; and (d) the reconstructed FBP image restored by the present SR-NLM algorithm with β = 200, τ =1.3×10⁻². All images are displayed with same window. The ROIs indicated by the red squares are zoomed in to display the image details.
Figure 7
Figure 7
The ROC curves from three different methods.
Figure 8
Figure 8
The patient study scanned with a protocol of 20 mAs and 120 kVp. (a) the conventional FBP image reconstructed with ramp filter from the original sinogram data; (b) the standard FBP image reconstructed from the restored sinogram data by the KL-PWLS algorithm with β = 1000 ; (c) the conventional FBP image restored by the original NLM algorithm with τ =7.7 ×10⁻⁴; and (d) the FBP image from by the present SR-NLM algorithm with β =1000, τ =1.7 ×10⁻³. Three ROIs indicated by squares allows comparison of the local signal-to-noise ratio. The line through a bony structure and the red line through a trachea and lung structure allow comparison of profiles. All images are displayed in the same window.
Figure 9
Figure 9
The vertical profiles (a) along a central line through a bony structure as indicated by the line located at the left in figure 8(a) and vertical profiles (b) along a central line through a trachea and lung structure as indicated by the line located at the center in figure 8(a).

Similar articles

Cited by

References

    1. Brenner DJ, Hall EJ. Computed tomography--an increasing source of radiation exposure. N Engl J Med. 2007;357:2277–84. - PubMed
    1. Einstein AJ, Henzlova MJ, Rajagopalan S. Estimating risk of cancer associated with radiation exposure from 64-slice computed tomography coronary angiography. JAMA. 2007;298:317–23. - PubMed
    1. Hsieh J. Adaptive streak artifact reduction in computed tomography resulting from excessive x-ray photon noise. Med Phys. 1998;25:2139–47. - PubMed
    1. Li T, Li X, Wang J, Wen J, Lu H, Hsieh J, et al. Nonlinear sinogram smoothing for low-dose x-ray ct. IEEE Trans Nucl Sci. 2004;51:2505–13.
    1. Kalender WA, Wolf H, Suess C, Gies M, Greess H, Bautz WA. Dose reduction in CT by online tube current control: principles and validation on phantoms and cadavers. European Radiology. 1999;9:323–328. - PubMed

Publication types

MeSH terms