. 2013 Jun 24;25(6):585-98.
doi: 10.1016/j.devcel.2013.05.022.

The extracellular domain of Notch2 increases its cell-surface abundance and ligand responsiveness during kidney development

Affiliations

The extracellular domain of Notch2 increases its cell-surface abundance and ligand responsiveness during kidney development

Zhenyi Liu et al. Dev Cell. .

Abstract

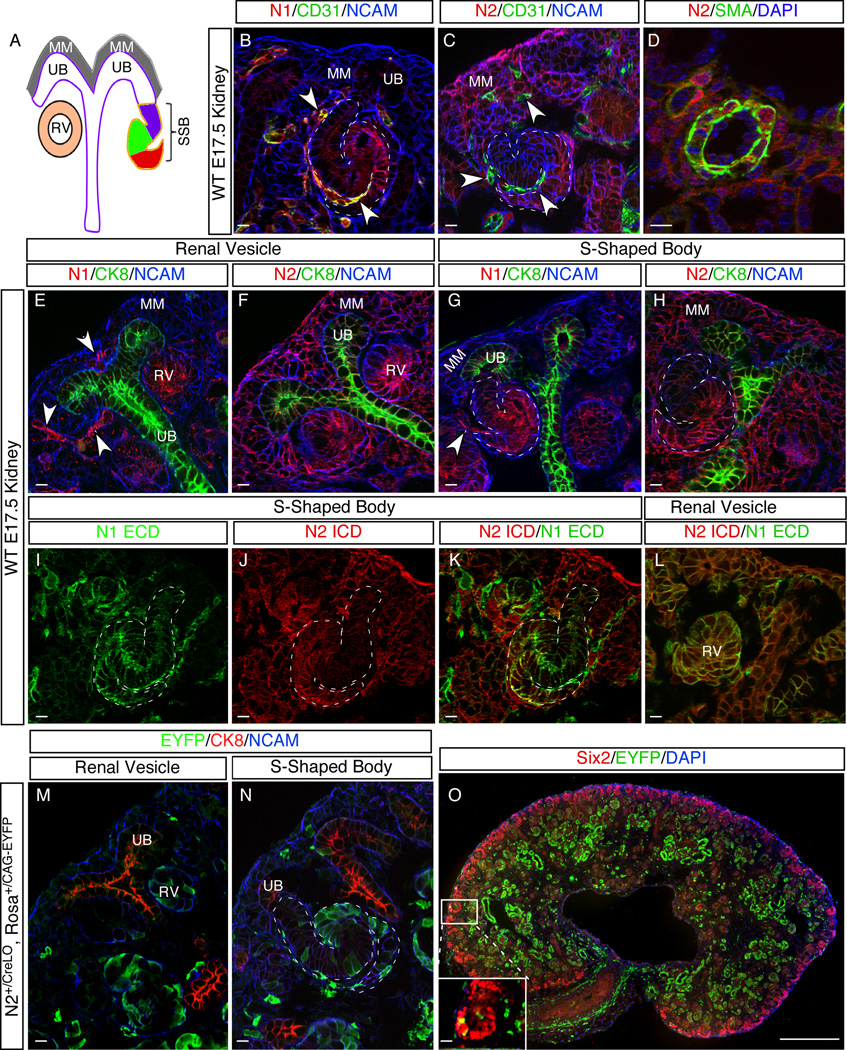
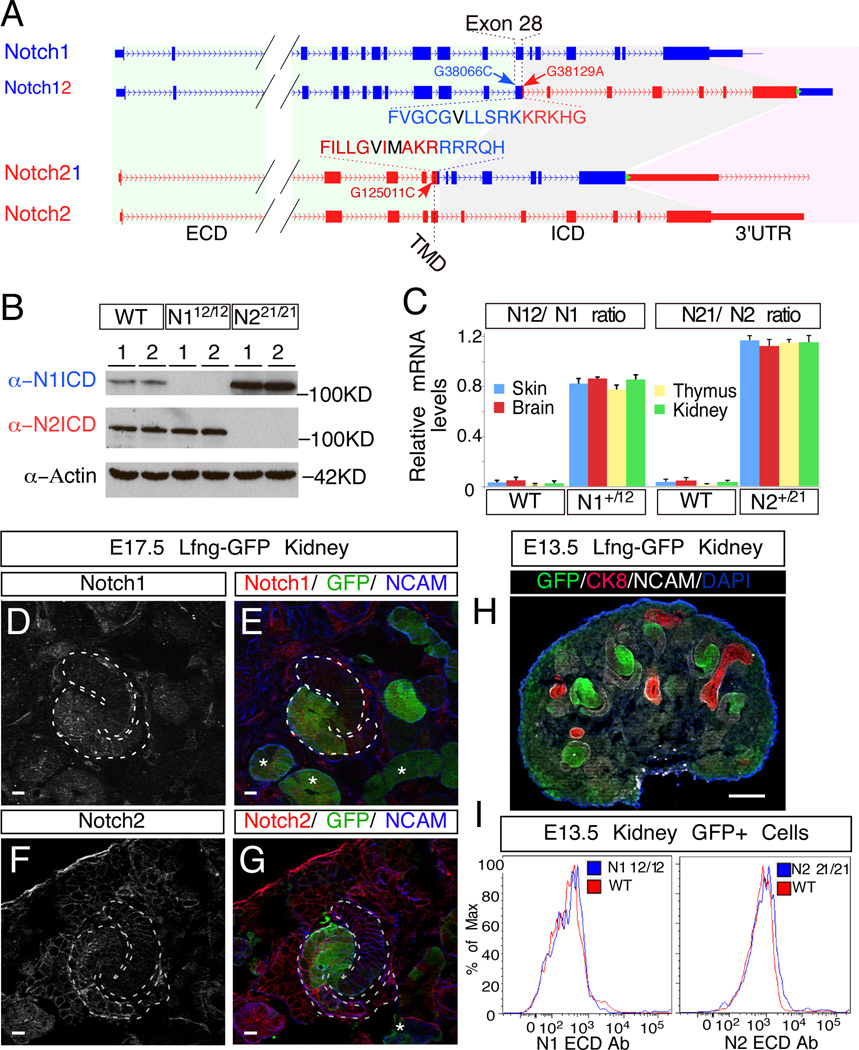
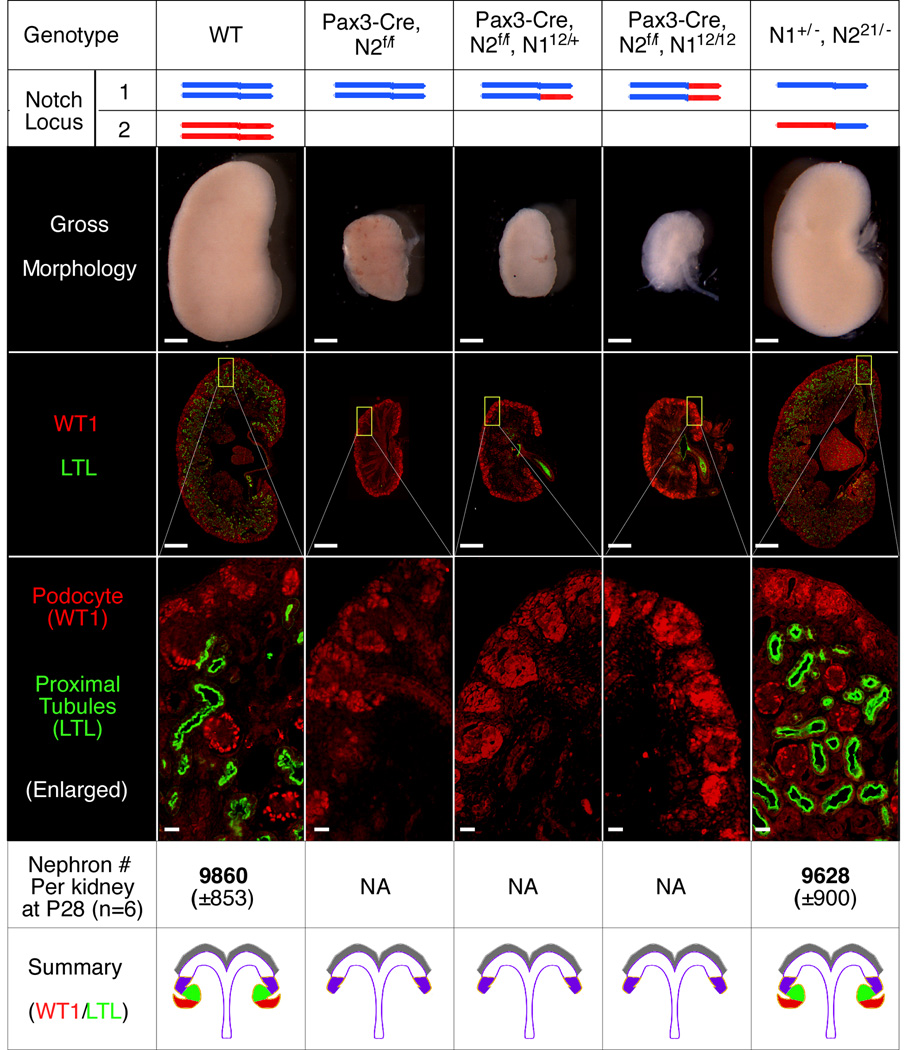
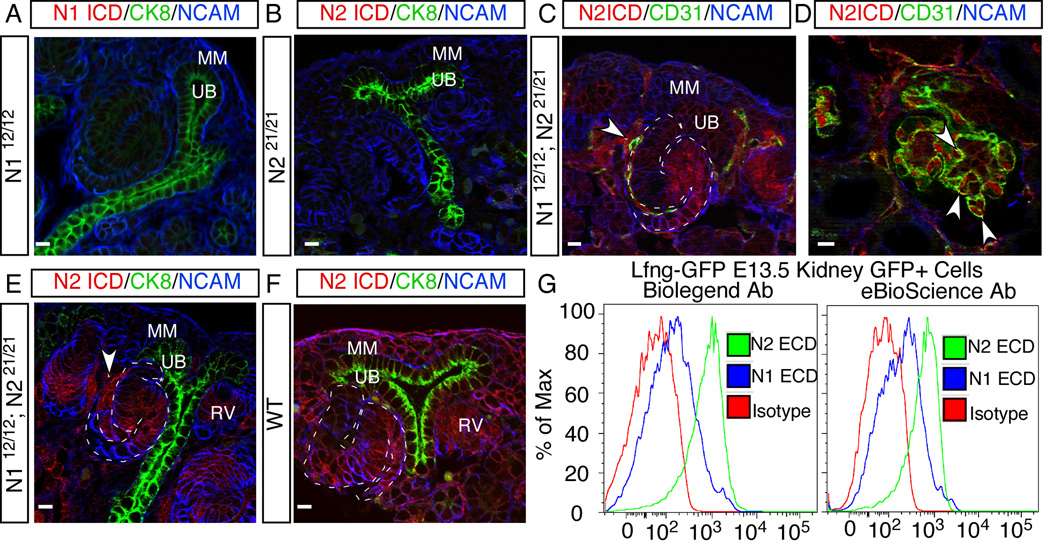
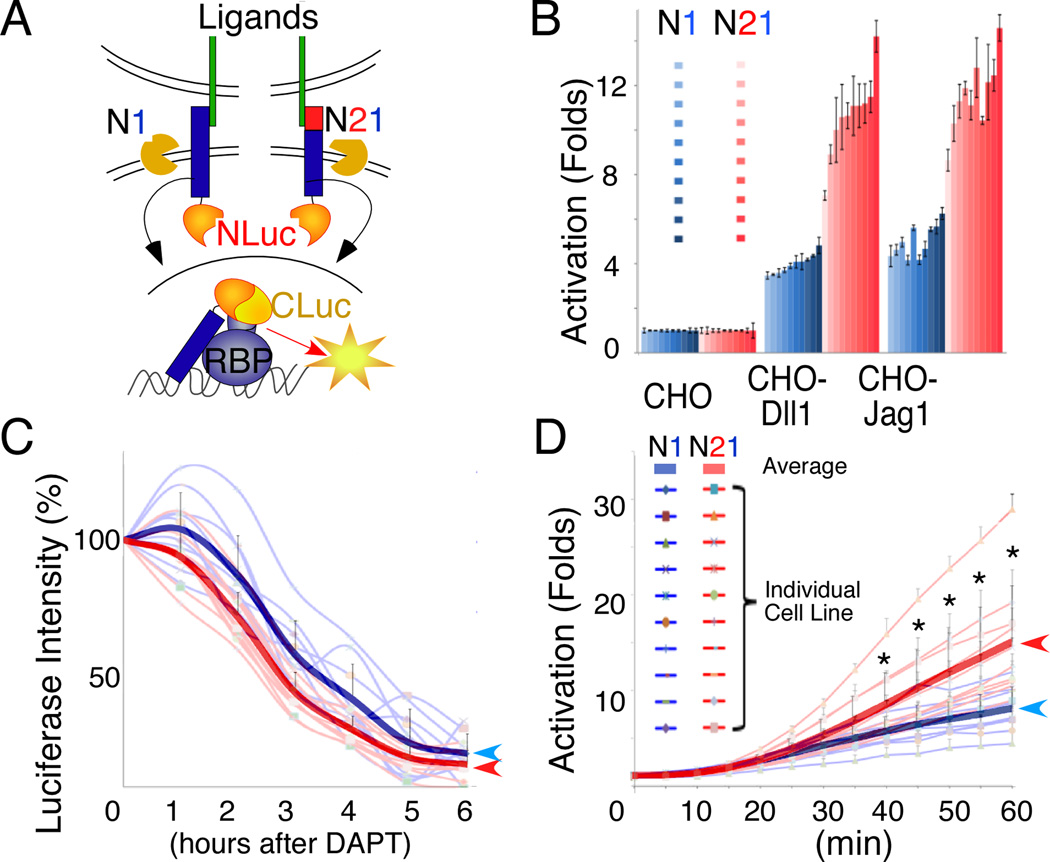
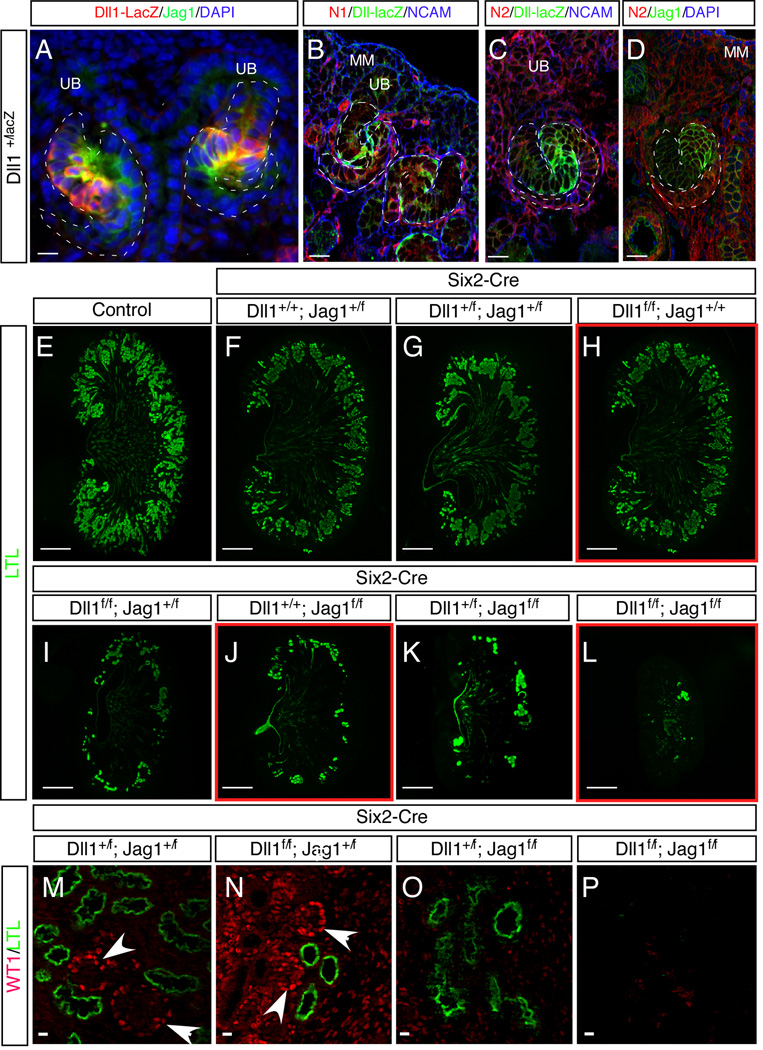
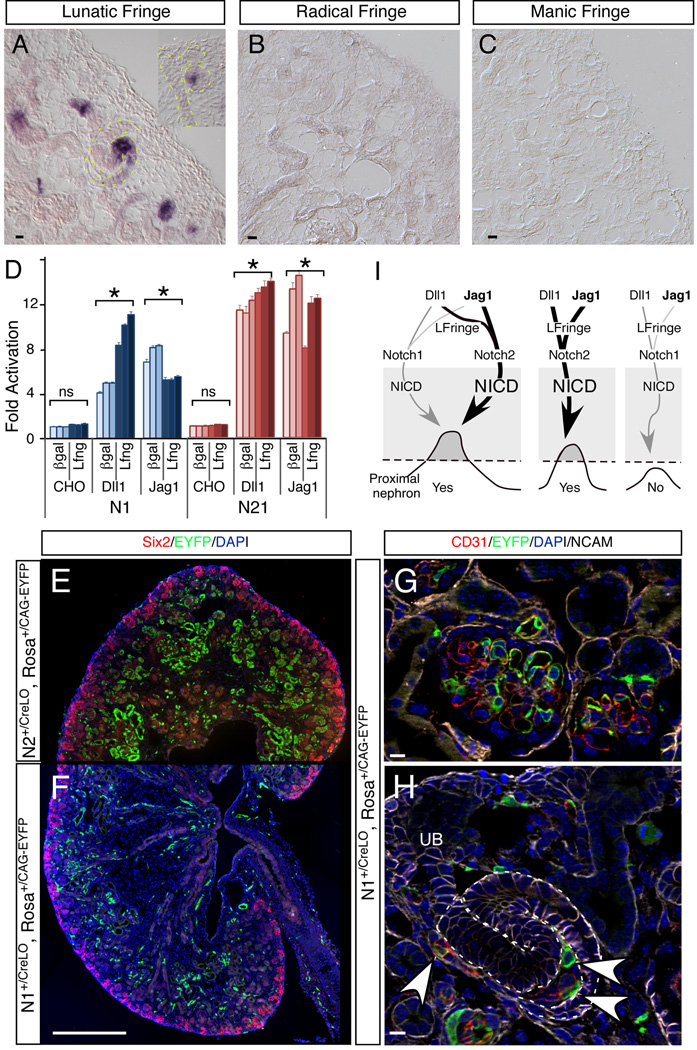
Notch2, but not Notch1, plays indispensable roles in kidney organogenesis, and Notch2 haploinsufficiency is associated with Alagille syndrome. We proposed that proximal nephron fates are regulated by a threshold that requires nearly all available free Notch intracellular domains (NICDs) but could not identify the mechanism that explains why Notch2 (N2) is more important than Notch1 (N1). By generating mice that swap their ICDs, we establish that the overall protein concentration, expression domain, or ICD amino acid composition does not account for the differential requirement of these receptors. Instead, we find that the N2 extracellular domain (NECD) increases Notch protein localization to the cell surface during kidney development and is cleaved more efficiently upon ligand binding. This context-specific asymmetry in NICD release efficiency is further enhanced by Fringe. Our results indicate that an elevated N1 surface level could compensate for the loss of N2 signal in specific cell contexts.


Figures

Figure 1
Figure 1
Variation in the expression pattern of N1 and N2 does not explain their functional difference. (A) Diagram showing major structures of developing nephrons. MM, metanephric mesenchyme; RV, renal vesicle; SSB, S-shaped body; UB, ureteric bud. The presumptive distal and proximal tubules, as well as podocyte precursor cells, are denoted in purple, green and red, respectively. (B–L) Comparison of N1 and N2 expression in different structures of an E17.5 kidney. CD31 marks endothelial cells; SMA (smooth muscle actin) marks vascular smooth muscle cells; CK8 (Cytokeratin 8) marks UB and its derivatives; NCAM marks all epithelial cells. Arrowheads denote endothelial cell precursors. (I–L) show the double staining with N1 ICD and N2 ECD antibodies. (M–O) Labeling pattern of N2∷Cre reporter in E17.5 kidney. All scale bars are 10µm except for O, which is 500µm. See also Figure S1.
Figure 2
Figure 2
Generation of the N12 and N21 alleles. (A) Schematic illustration of N1 (blue) and N2 (red) loci before and after the ICD swap. The N1 ICD encompasses 5,926bp on chromosome 2, ranging from nucleotide +38,103 to +44,028 (A in ATG is +1) and encoding amino acid 1,750 to 2,531; for N2, the ICD encompasses 8,699bp on chromosome 3, ranging from nucleotide +125,048 to +133,746 and encoding amino acid 1,705 to 2,473. Amino acids in black denote the S3 cleavage sites. Green triangle denotes FRT site. (B) Western blot analyses with ICD-specific antibodies of kidney extracts from newborn pups with designated genotypes (WT, N112/12 and N221/21; two different individuals per genotype). (C) mRNA level comparisons between chimeric N12 and N21 and their corresponding endogenous alleles in various tissues of wild type (WT), N1+/12 and N2+/21 newborn pups. Allele ratios were calculated by determining the G/C ratio at SNVs G38066C and G125011C introduced into the targeting constructs with pyrosequencing. Error bars represent standard deviation. (D–G) Double staining of EGFP and N1 (D and E) or N2 (F and G) on E17.5 Lfng-GFP kidneys. Asterisks (*) denote EGFP+ tubules. (H) EGFP labeling patterns in E13.5 Lfng-GFP kidney. (I) E13.5 Lfng-GFP kidneys with wild type (WT) or single homozygous (N112/12 or N221/21) Notch alleles were dissociated into single cells, stained with PE-conjugated N1 or N2 ECD-specific antibodies (eBioscience) and analyzed with flow cytometry. The cell surface levels of wild type (N1, N2) and chimeric (N12, N21) were compared in EGFP+ cells. Scale bars in D-G are 10µm and the one in H is 100µm. See also Figure S2, S3.
Figure 3
Figure 3
Notch ICDs can functionally replace each other and thus do not contribute to the functional difference of N1 and N2 in kidney development. Kidney phenotypes were characterized in newborn mice with the indicated genotypes. Scale bars: 500µm for whole kidneys; 20µm for the magnified windows showing WT1 and LTL staining. Standard deviations of nephron number are shown in the parentheses.
Figure 4
Figure 4
Although the total amount of N1 and N2 protein is similar in the epithelial cells of developing nephrons, N2 is more abundant at the cell surface. (A, B) Confirmation of the specificity of anti-N1 and -N2 ICD antibodies on kidney sections from N112/12 (A) and N221/21 (B) mice. (C, D) Anti-N2 ICD antibody staining on kidney sections from N112/12; N221/21 double-homozygous mice, in which all N2ICD is expressed from the N1 locus. (E, F) The levels of protein expressed from the N1 and N2 loci in developing RVs and SSBs were compared by immunostaining with N2 ICD specific antibodies on N112/12; N221/21 mice (the N1 locus, E) and wild type (the N2 locus, F). The secondary antibody was used without signal amplification and exposure times were identical for the red channel to allow quantitative comparisons. Arrowhead denotes endothelial cells. MM, metanephric mesenchyme; RV, renal vesicle; UB, ureteric bud. (G) Flow cytometry analysis on EGFP+ live cells from E13.5 Lfng-GFP kidneys with two different sets of anti-Notch ECD antibodies. All scale bars: 10µm. See also Figure S4.
Figure 5
Figure 5
N2 ECD is more potent than N1 ECD in mediating ligand-induced ICD release. (A) The Notch LCI strategy for comparing the potency of N1 and N2 ECDs: NLuc is fused to the C-terminus of N1 or N21. These two constructs were expressed from the same genomic locus in parental cell lines that stably express CLuc-RBP. For both N1 and N21, activation releases N1ICD-NLuc. The subsequent interaction of N1ICD-NLuc with CLuc-RBP reconstitutes luciferase. The amount of NICD released is proportional to the light produced. (B) and (D) show LCI results for 10 independent cell lines in the presence of either co-cultured ligand-expressing cells (CHO-Dll1 and CHO-Jag1) (B) or 100µM EGTA (D) (* denotes p<10−6, Student T-test). (C) The stability of N1ICD-Nluc fragments released from N1 and N21 fusion proteins, which differ by 6 amino acids at N-terminus (VLLSRK and VIMAKR, respectively), was determined by the luminescence lifetime measurements after blocking NICD-NLuc release with the γ-secretase inhibitor DAPT. Thick lines in (C) and (D) represent the average of N1 and N21 cell lines. All scale bars represent standard deviation. See also Figure S5.
Figure 6
Figure 6
Jag1 is the dominant ligand of N2 in the kidney. (A–D) Comparison of N1, N2, Dll1 and Jag1 expression in the developing nephron. (E–P) Phenotypes of newborn kidneys after ligand deletion. Scale bars: (A-D, M-P), 10µm; (E–L), 500µm. See also Figure S6.
Figure 7
Figure 7
The dominance of N2 in the developing kidney can be explained by a combination of factors that are mediated by the ECD: higher cell surface expression, greater responsiveness to ligand and selective modulation by Lfng. (A–C) In situ hybridization of three fringe genes in the developing kidney. (D) Effects of Lfng modification on Notch1 and Notch21 activation in HEK293 cells (* denotes p<0.05, Student T-test). All scale bars represent standard deviation. (E–H) Comparison of the labeling pattern between N2∷CreLO (E) and N1∷CreLO (F–H) in vivo in developing nephrons. Arrowheads denote endothelial cells. (I) A model proposing a NICD-dependent switch that regulates proximal nephron development and explaining how N2 achieves its dominant roles over N1. See discussion for details. The weight of lines indicates the weight of effects. Scale bars: (A–C), (G–H) 10µm; (E, F) 500µm.

Similar articles

Cited by

References

    1. Albu RI, Constantinescu SN. Extracellular domain N-glycosylation controls human thrombopoietin receptor cell surface levels. Frontiers in endocrinology. 2011;2:71. - PMC - PubMed
    1. Boyle SC, Kim M, Valerius MT, McMahon AP, Kopan R. Notch pathway activation can replace the requirement for Wnt4 and Wnt9b in mesenchymal-to-epithelial transition of nephron stem cells. Development. 2011;138:4245–4254. - PMC - PubMed
    1. Chen L, Al-Awqati Q. Segmental expression of Notch and Hairy genes in nephrogenesis. Am J Physiol Renal Physiol. 2005;288:F939–F952. - PubMed
    1. Cheng HT, Kim M, Valerius MT, Surendran K, Schuster-Gossler K, Gossler A, McMahon AP, Kopan R. Notch2, but not Notch1, is required for proximal fate acquisition in the mammalian nephron. Development. 2007;134:801–811. - PMC - PubMed
    1. Chu D, Zhang Z, Zhou Y, Wang W, Li Y, Zhang H, Dong G, Zhao Q, Ji G. Notch1 and Notch2 have opposite prognostic effects on patients with colorectal cancer. Ann Oncol. 2011;22:2440–2447. - PubMed

Publication types

MeSH terms