. 2013 Jun 24;25(6):599-609.
doi: 10.1016/j.devcel.2013.05.013.

Individual oligodendrocytes have only a few hours in which to generate new myelin sheaths in vivo

Affiliations

Individual oligodendrocytes have only a few hours in which to generate new myelin sheaths in vivo

Tim Czopka et al. Dev Cell. .

Abstract

The number of myelin sheaths made by individual oligodendrocytes regulates the extent of myelination, which profoundly affects central nervous system function. It remains unknown when, during their life, individual oligodendrocytes can regulate myelin sheath number in vivo. We show, using live imaging in zebrafish, that oligodendrocytes make new myelin sheaths during a period of just 5 hr, with regulation of sheath number after this time limited to occasional retractions. We also show that activation and reduction of Fyn kinase in oligodendrocytes increases and decreases sheath number per cell, respectively. Interestingly, these oligodendrocytes also generate their new myelin sheaths within the same period, despite having vastly different extents of myelination. Our data demonstrate a restricted time window relative to the lifetime of the individual oligodendrocyte, during which myelin sheath formation occurs and the number of sheaths is determined.


Figures

Figure 1
Figure 1. Dynamic Change in Global Myelination in the Larval Zebrafish Spinal Cord
(A) Lateral views of the anterior (left) and posterior (right) spinal cord in Tg(mbp:EGFP-CAAX) animals at 4 days postfertilization (dpf) (top) and 8 dpf (bottom) indicate a significant increase in the number of myelin sheaths over this period. Scale bar, 20 μm. (B) Lateral views of the anterior (left) and posterior (right) spinal cord in Tg(mbp:EGFP) animals at 4 days postfertilization (dpf) (top) and 8 dpf (bottom) indicate a significant increase in the number of myelinating oligodendrocytes over this period. Scale bar, 20 μm. (C) Quantification of myelinating oligodendrocyte number in the anterior and posterior spinal cord at 4 and 8 dpf. Significance was tested using Student’s two-tailed unpaired t test. Error bars indicate SD. (D) Lateral views of a single axon labeled by cntn1b:mCherry and myelin sheaths labeled with Tg(mbp:EGFP-CAAX) at 4 dpf (top) and 8 dpf (bottom) show that the deposition of new myelin sheaths along single axons can occur over the course of several days. Arrowheads indicate putative nodes of Ranvier. Scale bar, 10 μm. (E) Quantification of the percentage axon length covered by myelin between 4 and 9 dpf. Each line represents a distinct axon. (F) Subset of axons shown in (E) where myelin sheath number increased over time. (G) Subset of axons shown in (E) where myelin sheath number does not change over time.
Figure 2
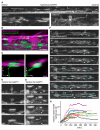
Figure 2. Individual Oligodendrocytes Initiate New Myelin Sheaths in a Short Time Window
(A) Top: lateral view of a 0.75 mm stretch of the zebrafish spinal cord at 3 dpf indicates a gradient from anterior to posterior in the differentiation status of oligodendrocytes in a Tg(nkx2.2a:meGFP) animal. Scale bar, 50 μm. Bottom: cells located in the anterior spinal cord have a mature myelinating morphology (left), whereas those in more posterior regions of the spinal cord have a less mature premyelinating morphology (right). Scale bar, 10 μm. (B) Lateral view of a Tg(nkx2.2a:mEGFP), Tg(cntn1b:mCherry) double transgenic zebrafish at 3 dpf shows a single oligodendrocyte with nascent myelin sheaths surrounding axons. Scale bar, 10 μm. (C) Higher magnification x,y (left panel) and x,z (right panel) views of a Tg(nkx2.2a:mEGFP), Tg(cntn1b:mCherry) animal confirm that nkx2.2a:mEGFP-labeled oligodendrocyte processes surround axons. Scale bar, 2 μm. (D) Single selected images from a time-lapse series of an oligodendrocyte process in a Tg(nkx2.2a:mEGFP) zebrafish reveal transformation of an exploratory process into a myelin sheath within a few hours. Scale bar, 5 μm. (E) Single selected images from a time-lapse series showing that nascent myelin sheaths can be retracted (arrowheads) over a period of a few hours. Scale bar, 5 μm. (F) Selected images from a time-lapse series of a single oligodendrocyte in a Tg(nkx2.2a:mEGFP) animal. The cell makes its first nascent myelin sheath (indicated by “#1”) at time point zero (see main text) and its final new myelin sheath (indicated by “#15”) by the 210 min time point. Examples of nascent myelin sheaths that are retracted during the time-lapse are indicated by arrowheads. Scale bar, 10 μm. (G) Total number of nascent myelin sheaths for 16 different oligodendrocytes over time. Time point zero is the time at which each oligodendrocyte initiates its first myelin sheath. The cell from (F) is colored in cyan. See also Movie S1.
Figure 3
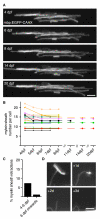
Figure 3. Mature Myelinating Oligodendrocytes Never Generate New Myelin Sheaths but Do Remove a Small Number over Time
(A) Single mbp:EGFP-CAAX-expressing oligodendrocyte imaged from 4 through 20 dpf. Scale bar, 10 μm. (B) Quantification of myelin sheath number of individual myelinating oligodendrocytes over time. (C) Percentage of myelin sheath retractions over the time periods analyzed in (B). (D) Confocal images of a single myelinating process at 4 dpf (left) that is retracted slowly over the course of the following 3 days. Scale bar, 5 μm. See also Figure S3 and Movies S4 and S5.
Figure 4
Figure 4. Manipulation of Fyn Alters Myelin Sheath Number per Oligodendrocyte
(A) mbp:EGFP-CAAX-expressing oligodendrocytes at 7 dpf in Tg(mbp:wt-Fyn) (top) and Tg(mbp:ca-Fyn) animals (bottom). Scale bar, 10 μm. (B) Oligodendrocytes in Tg(mbp:ca-Fyn) animals have a higher number of myelin sheaths than control or those in Tg(mbp:wt-Fyn) animals. Significance was assessed using one-way ANOVA. Error bars indicate SD. (C) The average length of myelin sheath per cell is not significantly different between control, Tg(mbp:wt-Fyn), or Tg(mbp:ca-Fyn) animals. Significance was assessed using one-way ANOVA. Error bars indicate SD. (D) mbp:EGFP-CAAX-expressing oligodendrocytes in control (top) and fyn morphant (bottom). Scale bar, 10 μm. (E) fyn morphants have a reduction in myelin sheath number per cell compared to control. Significance was assessed using Student’s two-tailed unpaired t test. Error bars indicate SD. (F) The average length of myelin sheaths per cell does not change following Fyn loss-of-function. Significance was assessed using Student’s two-tailed unpaired t test. Error bars indicate SD. See also Figures S1 and S2.
Figure 5
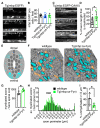
Figure 5. Constitutive Activation of Fyn in Myelinating Oligodendrocytes Causes Precocious Myelination without Affecting Cell Number
(A) Confocal images of Tg(mbp:EGFP) wild-type control (top), Tg(mbp:wt-Fyn) (middle), and Tg(mbp:ca-Fyn) (bottom) animals at 8 dpf show no difference in oligodendrocyte number or distribution. Scale bar, 25 μm. (B) Quantification of myelinating oligodendrocyte number at 8 dpf reveals no differences between wild-type, Tg(mbp:wt-Fyn), and Tg(mbp:ca-Fyn) animals. Significance was assessed using one-way ANOVA. Error bars indicate SD. (C) High-magnification views of the dorsal spinal cord at 8 dpf in Tg(mbp:EGFP-CAAX) control (top), Tg(mbp: wt-Fyn) (middle), and Tg(mbp:ca-Fyn) (bottom) animals show that there are additional myelinated axons in Tg(mbp:ca-Fyn) animals. Scale bar, 10 μm. (D) Quantification showing percentage of single axon length myelinated in control compared to Tg(mbp:ca-Fyn) animals by 5 dpf. Significance was assessed using Student’s two-tailed unpaired t test. Error bars indicate SD. (E) Schematic transverse cross-section of the larval zebrafish spinal cord indicating myelinated axons in cyan. (F) Transmission electron microscope images of transverse sections of spinal cords at 8 dpf of an area indicated in (E) in wild-type (left) and Tg(mbp:ca-Fyn) (right) animals. There is a larger number of myelinated axons (shaded in cyan) in Tg(mbp:ca-Fyn) animals and a smaller number of large caliber (>1.5mm perimeter) unmyelinated axons (shaded in orange). Scale bar, 1 μm. (G) The number of myelinated axons per hemi spinal cord is increased in Tg(mbp:ca-Fyn) animals compared to wild-type. Significance was assessed using Student’s two-tailed t test. Error bars indicate SD. (H) The distribution of myelinated axon size (assessed by axonal perimeter) in wild-type and Tg(mbp:ca-Fyn) animals is similar. The additional axons myelinated in Tg(mbp:ca-Fyn) animals compared to control are almost all between 1 and 2 μm in perimeter (arrowheads). (I) Quantification of percentage unmyelinated axons with a perimeter >1.5 μm in wild-type and Tg(mbp:ca-Fyn) dorsal spinal cord. Significance was assessed using Student’s two-tailed unpaired t test. Error bars indicate SD. See also Figure S1.
Figure 6
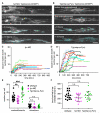
Figure 6. Myelin Sheaths Are Generated during the Same Short Dynamic Period following Fyn Loss and Gain of Function
(A) Images of a single oligodendrocyte in a Tg(nkx2.2a:mEGFP) fyn morphant during initiation of myelination. The first ensheathment is indicated with “#1.” Scale bar, 10 μm. (B) Images of a single oligodendrocyte in a Tg(nkx2.2a:mEGFP), Tg(mbp:ca-Fyn) animal during initiation of myelination. The first ensheathments are indicated with “#1” and “#2.” Scale bar, 10 μm. (C) Total number of nascent myelin sheaths for 13 different fyn morphant oligodendrocytes over time. Time point zero is set as the time at which each oligodendrocyte starts to make its first myelin sheath. The cell from (A) is colored in cyan. (D) Total number of nascent myelin sheaths for 14 different oligodendrocytes in Tg(mbp:ca-Fyn) animals over time. Time-point zero is set as the time at which each oligodendrocyte starts to make its first myelin sheath. The cell from (B) is colored in cyan. (E) Ensheathment, but not retraction, number changes with Fyn manipulation. Significance was assessed using two-way ANOVA. Error bars indicate SD. (F) The duration of myelin sheath formation by individual oligodendrocytes is similar in wild-type, fyn morphant, and Tg(mbp:ca-Fyn) animals. Significance was assessed using one-way ANOVA. Error bars indicate SD. See also Figures S1 and S2 and Movies S1, S2, and S3.

Comment in

  • Can't wait to myelinate.
    Glenn TD, Talbot WS. Glenn TD, et al. Dev Cell. 2013 Jun 24;25(6):549-50. doi: 10.1016/j.devcel.2013.06.003. Dev Cell. 2013. PMID: 23806613

References

    1. Almeida RG, Czopka T, ffrench-Constant C, Lyons DA. Individual axons regulate the myelinating potential of single oligodendrocytes in vivo. Development. 2011;138:4443–4450. - PMC - PubMed
    1. Brinkmann BG, Agarwal A, Sereda MW, Garratt AN, Müller T, Wende H, Stassart RM, Nawaz S, Humml C, Velanac V, et al. Neuregulin-1/ErbB signaling serves distinct functions in myelination of the peripheral and central nervous system. Neuron. 2008;59:581–595. - PMC - PubMed
    1. Chong SYC, Rosenberg SS, Fancy SPJ, Zhao C, Shen Y-AA, Hahn AT, McGee AW, Xu X, Zheng B, Zhang LI, et al. Neurite outgrowth inhibitor Nogo-A establishes spatial segregation and extent of oligodendrocyte myelination. Proc. Natl. Acad. Sci. USA. 2012;109:1299–1304. - PMC - PubMed
    1. Czopka T, Lyons DA. Dissecting mechanisms of myelinated axon formation using zebrafish. Methods Cell Biol. 2011;105:25–62. - PubMed
    1. Dawson MRL, Polito A, Levine JM, Reynolds R. NG2-expressing glial progenitor cells: an abundant and widespread population of cycling cells in the adult rat CNS. Mol. Cell. Neurosci. 2003;24:476–488. - PubMed

Publication types

MeSH terms

Substances