. 2013 Sep 21;13(18):3599-608.
doi: 10.1039/c3lc50350j.

Microfluidic heart on a chip for higher throughput pharmacological studies

Affiliations

Microfluidic heart on a chip for higher throughput pharmacological studies

Ashutosh Agarwal et al. Lab Chip. .

Abstract

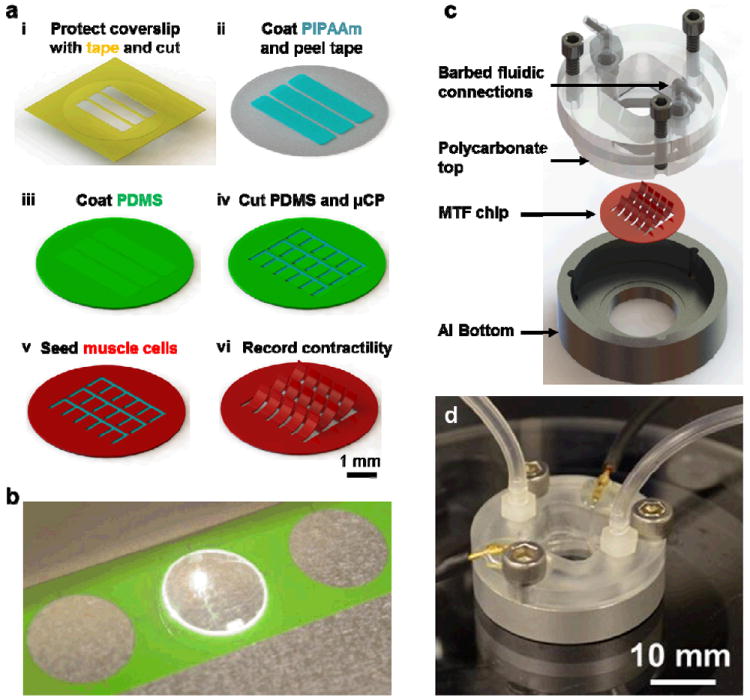
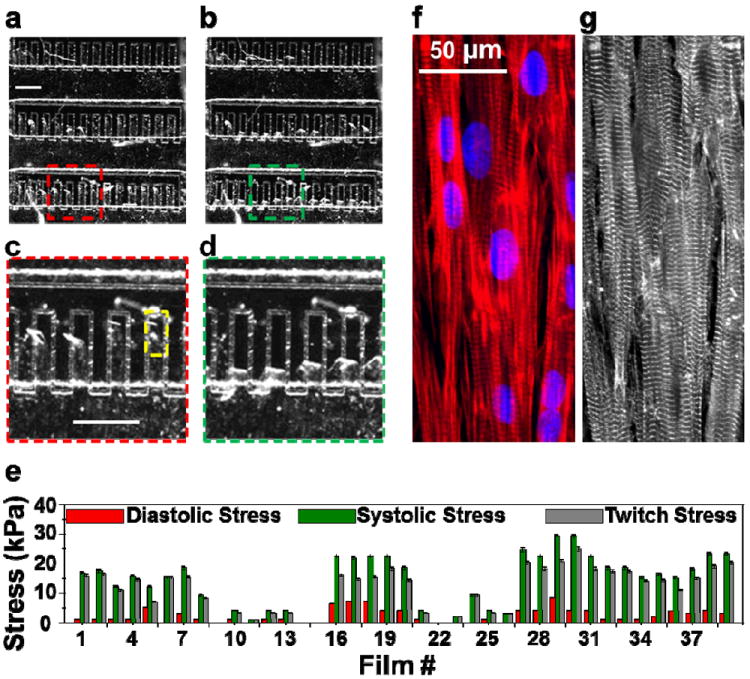
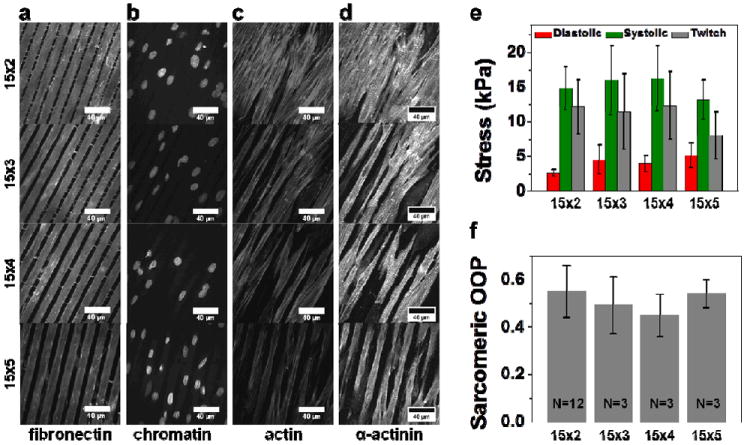
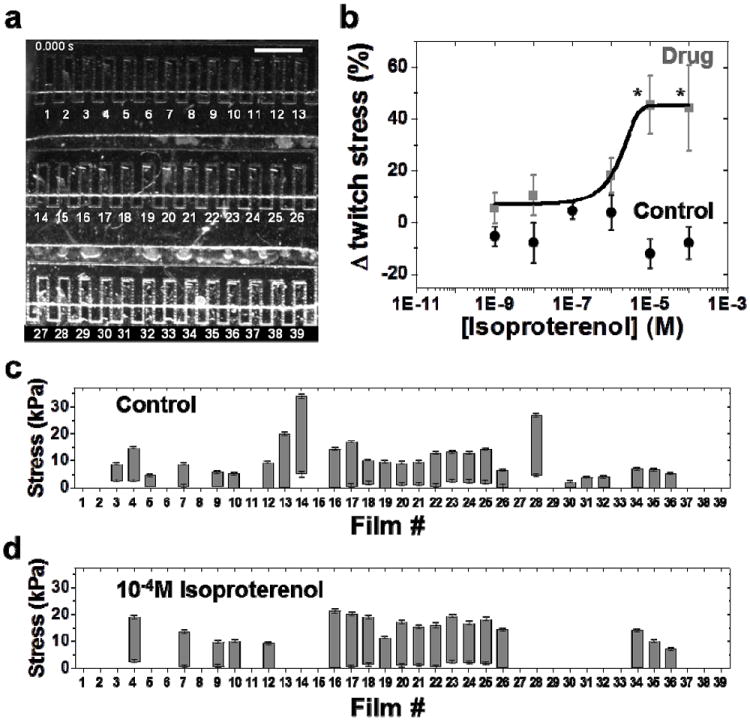
We present the design of a higher throughput "heart on a chip" which utilizes a semi-automated fabrication technique to process sub millimeter sized thin film cantilevers of soft elastomers. Anisotropic cardiac microtissues which recapitulate the laminar architecture of the heart ventricle are engineered on these cantilevers. Deflection of these cantilevers, termed Muscular Thin Films (MTFs), during muscle contraction allows calculation of diastolic and systolic stresses generated by the engineered tissues. We also present the design of a reusable one channel fluidic microdevice completely built out of autoclavable materials which incorporates various features required for an optical cardiac contractility assay: metallic base which fits on a heating element for temperature control, transparent top for recording cantilever deformation and embedded electrodes for electrical field stimulation of the tissue. We employ the microdevice to test the positive inotropic effect of isoproterenol on cardiac contractility at dosages ranging from 1 nM to 100 μM. The higher throughput fluidic heart on a chip has applications in testing of cardiac tissues built from rare or expensive cell sources and for integration with other organ mimics. These advances will help alleviate translational barriers for commercial adoption of these technologies by improving the throughput and reproducibility of readout, standardization of the platform and scalability of manufacture.


Figures

Figure 1
Figure 1
Higher throughput heart on a chip and fluidic microdevice. (a) A schematic of fabrication process (i) A glass coverslip is covered with protective tape and PIPAAm islands are cut into by an engraving laser and peeled using a sharp tweezer. (ii) A thin layer of PIPAAm is spun coat, (iii) the tape is removed and PDMS is spun coat. (iv) The boundaries of thin films are then cut into the PDMS and peeled. (v) The chip is then ready for micro contact printing of fibronectin and cell seeding. (vi) Upon PIPAAm dissolution, individual MTFs are released from the surface and interrogated optically. (b) Image of the engraving laser processing MTFs in an 18 mm diameter chip. A batch of multiple chips can be fabricated by this computer aided design process. (c) Exploded view of the conception and assembly of a fluidic device which fits an 18 mm chip. The device consists of an aluminum bottom with a recess to hold the chip, a transparent polycarbonate top held in place by three screws and barbed fittings for fluidic input and output. (d) Image of an actual device in action. The connection for electrical field stimulator can also be seen in addition to the fluidic tubing.
Figure 2
Figure 2
Operation of the higher throughput heart on a chip. Brightfield image of the chip during (a) diastole and (b) peak systole. Scale bar in (a) represents 1 mm. Films bend up during diastole and their contraction is more pronounced during peak systole. Note that the abrasion into glass indicate the location of PIPAAm island and the boundary of each MTF before contraction. (c) and (d) represent the zoomed sections of (a) and (b), respectively as indicated for better clarity. Scale bar in (c) represents 1 mm. (e) Diastolic, peak systolic and twitch stresses for each MTF from this chip are plotted (Average±SD for four contraction cycles). In this representative example, operation of one higher-throughput chip provided 35 replicates and an average twitch stress of 12.7 ± 1.1 kPa (N = 35, Mean±SEM). Immunostain overlay of the (f) actin filaments (red) and nuclei (blue) and (g) α-actinin show the formation of anisotropic confluent monolayer formation of cardiac tissue on thin film area indicated by yellow rectangle in (c).
Figure 3
Figure 3
Application of the higher throughput chip towards evaluation of the effect of tissue architecture on tissue contractility. Immunostains of tissue prepared by micropatterning 15μm lines of fibronectin separated by gaps of 2 (Panel i), 3 (Panel ii), 4 (Panel iii) and 5μm (Panel iv). Panel a, b, c, d show the fluorescence images of immunostains for fibronectin, chromatin (DAPI), actin, and sarcomeric α-actinin, respectively. Fibronectin immunostain reveal that microcontact printed fibronectin matched accurately the feature geometry of the stamp. (e) Peak diastolic, systolic and twitch stresses calculated from one chip for each condition (Mean±SEM, N=30 for 15×2, N=28 for 15×3, N=30 for 15×4, N=34 for 15×5). (f) Orientational order parameter (OOP) for sarcomeric alignment in cardiac tissue engineered with different surface patterns. (Mean ± SD, N indicated on the bar graphs represent the number of chips for each condition with at least 3 fields of view of 160μm × 160μm per chip).
Figure 4
Figure 4
Evaluation of the effect of isoproterenol on cardiac contractility. (a) Brightfield image of a higher throughput chip during drug dose response studies within the fluidic microdevice. Scale bar represents 1 mm. (b) Complete isoproterenol dose response curve (data points represented by gray squares) generated from the operation of one fluidic chip (N = 19 MTFs, Mean±SEM, * = statistically different from baseline, p < 0.05). Black circles represent the data points for control experiment to evaluate cardiac contractility in the absence of isoproterenol. Drug-free Tyrode’s solution is injected into the fluidic device at the same time points as for conducting drug dose response studies (N = 23 MTFs, Mean±SEM). (c) Baseline stresses (before exposure to isoproterenol) of individual MTFs. Minima, maxima and the length of the each bar graph represent the diastolic, peak systolic, and twitch stress generated by the corresponding MTF, respectively. Error bars for diastolic and peak systolic stress represent the standard deviation in the average measurement over four contraction cycles. (d) Stress generated by the same MTFs at the highest isoproterenol concentration of 10-4M.

References

    1. Eisenstein EL, Lemons PW, Tardiff BE, Schulman KA, Jolly MK, Califf RM. American Heart Journal. 2005;149:482–488. - PubMed
    1. Fermini B, Fossa AA. Nat Rev Drug Discov. 2003;2:439–447. - PubMed
    1. Huh D, Torisawa YS, Hamilton GA, Kim HJ, Ingber DE. Lab on a Chip. 2012;12:2156–2164. - PubMed
    1. Moraes C, Mehta G, Lesher-Perez SC, Takayama S. Annals of Biomedical Engineering. 2012;40:1211–1227. - PubMed
    1. van der Meer AD, van den Berg A. Integrative Biology. 2012;4:461–470. - PubMed

Publication types