Review
. 2013 Aug;8(8):785-95.
doi: 10.4161/epi.25440. Epub 2013 Jun 27.

Epigenetic pathways and glioblastoma treatment

Affiliations
Review

Epigenetic pathways and glioblastoma treatment

Jennifer Clarke et al. Epigenetics. 2013 Aug.

Abstract

Glioblastoma multiforme (GBM) is the most common malignant adult brain tumor. Standard GBM treatment includes maximal safe surgical resection with combination radiotherapy and adjuvant temozolomide (TMZ) chemotherapy. Alarmingly, patient survival at five-years is below 10%. This is in part due to the invasive behavior of the tumor and the resulting inability to resect greater than 98% of some tumors. In fact, recurrence after such treatment may be inevitable, even in cases where gross total resection is achieved. The Cancer Genome Atlas (TCGA) research network performed whole genome sequencing of GBM tumors and found that GBM recurrence is linked to epigenetic mechanisms and pathways. Central to these pathways are epigenetic enzymes, which have recently emerged as possible new drug targets for multiple cancers, including GBM. Here we review GBM treatment, and provide a systems approach to identifying epigenetic drivers of GBM tumor progression based on temporal modeling of putative GBM cells of origin. We also discuss advances in defining epigenetic mechanisms controlling GBM initiation and recurrence and the drug discovery considerations associated with targeting epigenetic enzymes for GBM treatment.

Keywords: drug discovery; epigenetics; glioblastoma; statistical modeling.


Figures

None
Figure 1. Possible cells of origin of glioma. Studies in mouse models have shown that various cell types can give rise to glioma. Neural stem cells (NSCs) give rise to other Neural Stem Cells, Astrocytes, Astrocyte-like cells, and neurons. Liu et al. 2011 demonstrated that NSCs give rise to OPCs, which can give rise to glioma. Friedmann-Morvinski et al. 2012 demonstrated that astrocytes and neurons can give rise to glioma. Hambardzumyan et al. 2011 demonstrated that astrocytes can give rise to glioma after PDGF overexpression and Ink4a, and ARF deletion. Koso et al. 2012 demonstrated that overexpression of a mutagenic Sleeping Beauty (SB) transposon (T2/Onc2) along with a dominant negative p53 in astrocyte like cells can give rise to glioma. Chen et al., 2012 demonstrated that NSCs could give rise to glioma after Nf1, p53, and Pten deletion. Neural Stem Cells can give to proneural, mesenchymal, and neural cell lineages.
None
Figure 2. Competing endogenous RNA levels modulate expression of oncogenes and tumor suppressors. (A) The levels of oncogenes can be modulated by an increase in levels in competing endogenous RNAs. microRNAs are titrated away from mRNAs encoding oncogenes when the levels of competing endogenous RNAs are increased. This leads to increased expression of oncogenes. (B) The levels of tumor suppressor proteins are modulated by decreases in the levels of competing endogenous RNAs. microRNAs bind to RNAs of tumor suppressors, thereby reducing tumor suppressor protein expression after transformation.
None
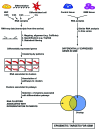
Figure 3. A bioinformatics and statistical pipeline for identifying epigenetic targets for GBM from transcriptome data. Hypothetical pipeline for identifying epigenetic targets in GBM based on differentially expressed pathways in both differentiating neural stem cell and GBM. Left Panel: Differentiating neural stem cells are analyzed for changes in RNA transcript levels by performing RNA-sequencing analysis of differentiating cells. RNA sequencing yields transcripts expressed over time. Mapping/alignment of transcripts using human genome is performed using Tophat and quantification of aligned transcripts is then performed using Cufflinks, or similar bioinformatics pipeline. Statistical filtering by t-tests or analysis of variance after quantification yields differentially expressed genes. Clustering of genes by patterns is then performed to identifying RNAs that are associated with differentiation pathways. Right Panel: RNA-sequencing of GBM and control tissue is performed to identify differentially expressed genes using the same bioinformatics pipeline utilized in analyzing differentiating neural stem cells. The degree of overlap of those transcripts, which are differentially expressed during differentiation, and in GBM is then calculated to identify epigenetic targets in GBM.
None
Figure 4. Examples of statistical models for neural temporal data. (A) Time series. Each transcript is modeled separately (univariate) or as part of a group (multivariate). The model uses information from previous time points in modeling future time points, and can capture contemporaneous and lagged dependencies among transcripts. (B) Discrete Markov chain model. Each cellular stage is considered a “state” and the chain models the probabilities of moving from one “state” to another in a given time step. Depending on the type of Markov model it may or may not be possible to move both backward and forward in time, and hence for cells to differentiate as well as dedifferentiate. (C) Bayesian network model. If we consider a directed acyclic graph (DAG), then we define a joint probability distribution over cellular states. For each node or state we define a probability distribution for transcription in each state, conditional on transcription in previous states. If we consider a dynamic graphical model (DGM), then we can model each state with a graphical model, and separately model the movement from state to state across time. In this way transcripts can have contemporaneous as well as time-dependent relationships. NSC, neural stem cell; OPC1, oligodendrocyte precursor cell 1; OPC2, oligodendrocyte precursor cell 2; Olig, oligodendrocyte; GBM, glioblastoma cell. Pa1 is the probability that a neural stem cell remains a stem cell from one time point to the next. Pa2 is the probability that a neural stem cell transforms from the current time point to the next time point. Pb3 is the probability that a GBM cell de-differentiates from the current time point to the prior time point. Pb1 is the probability that a GBM cell remains a GBM cell from the current time point to the next. Pc2 is the probability that an oligodendrocyte precursor cell (OPC) transforms from the current time point to the next. Pc1 is the probability that an OPC remains an OPC from the current time point to the next. Pb2 is the probability that a GBM cell de-differentiates into an OPC from the current time point to the next time point. Pc4 is the probability that an OPC differentiates into an oligodendrocyte from the current time point to the next time point. Pc3 is the probability that an OPC dedifferentiates into a neural stem cell from the current time point to the next. Pa3 is the probability that a NSC differentiates into an OPC from the current time point to the next. Pd1 is the probability that an oligodendrocyte will remain an oligodendrocyte from the current time point to the next. Pd2 is the probability that an oligodendrocyte dedifferentiates into an OPC form the current time point to the next. Pa1+Pa2+Pa3 = 1; Pb1+Pb2+Pb3 = 1; Pc1+Pc2+Pc3 = 1.

Similar articles

Cited by

References

    1. Lacroix M, Abi-Said D, Fourney DR, Gokaslan ZL, Shi W, DeMonte F, et al. A multivariate analysis of 416 patients with glioblastoma multiforme: prognosis, extent of resection, and survival. J Neurosurg. 2001;95:190–8. doi: 10.3171/jns.2001.95.2.0190. - DOI - PubMed
    1. Chen J, McKay RM, Parada LF. Malignant glioma: lessons from genomics, mouse models, and stem cells. Cell. 2012;149:36–47. doi: 10.1016/j.cell.2012.03.009. - DOI - PMC - PubMed
    1. Liu C, Sage JC, Miller MR, Verhaak RG, Hippenmeyer S, Vogel H, et al. Mosaic analysis with double markers reveals tumor cell of origin in glioma. Cell. 2011;146:209–21. doi: 10.1016/j.cell.2011.06.014. - DOI - PMC - PubMed
    1. Koso H, Takeda H, Yew CC, Ward JM, Nariai N, Ueno K, et al. Transposon mutagenesis identifies genes that transform neural stem cells into glioma-initiating cells. Proc Natl Acad Sci U S A. 2012;109:E2998–3007. doi: 10.1073/pnas.1215899109. - DOI - PMC - PubMed
    1. Friedmann-Morvinski D, Bushong EA, Ke E, Soda Y, Marumoto T, Singer O, et al. Dedifferentiation of neurons and astrocytes by oncogenes can induce gliomas in mice. Science. 2012;338:1080–4. doi: 10.1126/science.1226929. - DOI - PMC - PubMed

Publication types

MeSH terms

LinkOut - more resources