. 2013 Jul 21;58(14):4981-5005.
doi: 10.1088/0031-9155/58/14/4981. Epub 2013 Jun 27.

Transcranial passive acoustic mapping with hemispherical sparse arrays using CT-based skull-specific aberration corrections: a simulation study

Affiliations

Transcranial passive acoustic mapping with hemispherical sparse arrays using CT-based skull-specific aberration corrections: a simulation study

Ryan M Jones et al. Phys Med Biol. .

Abstract

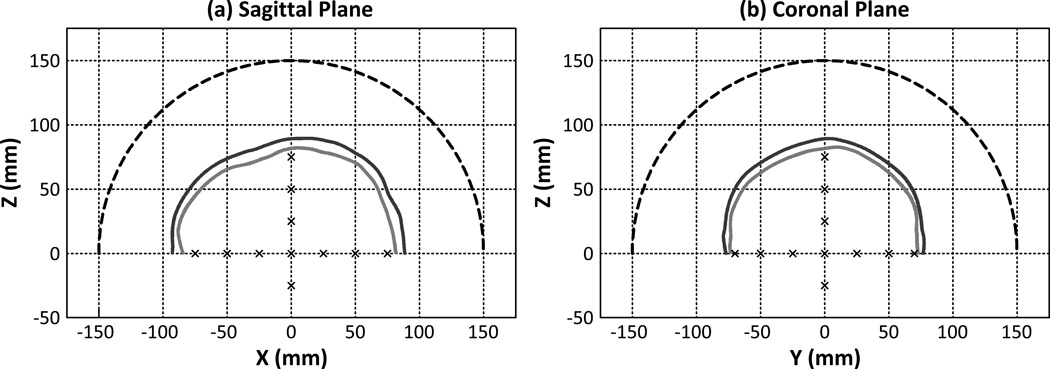
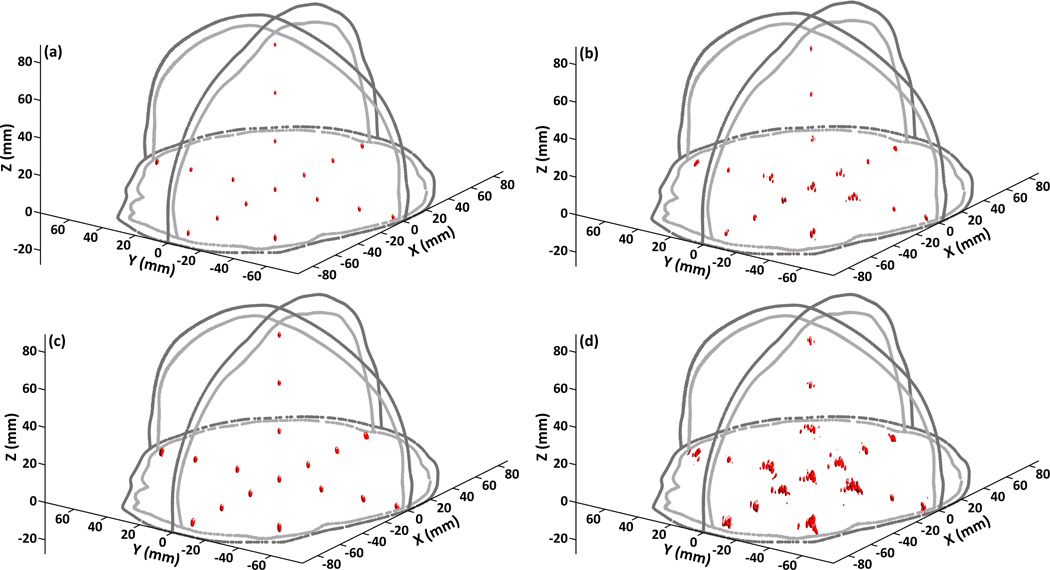
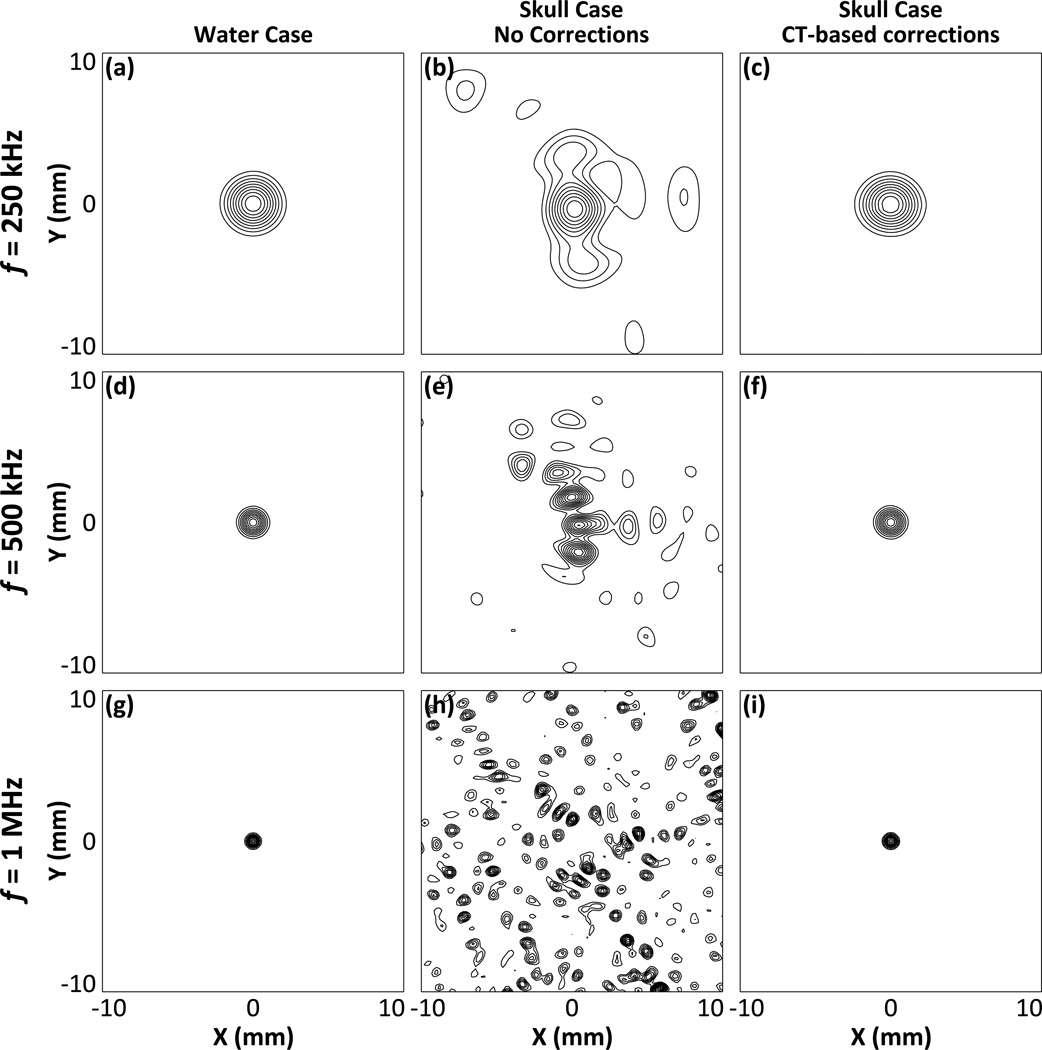
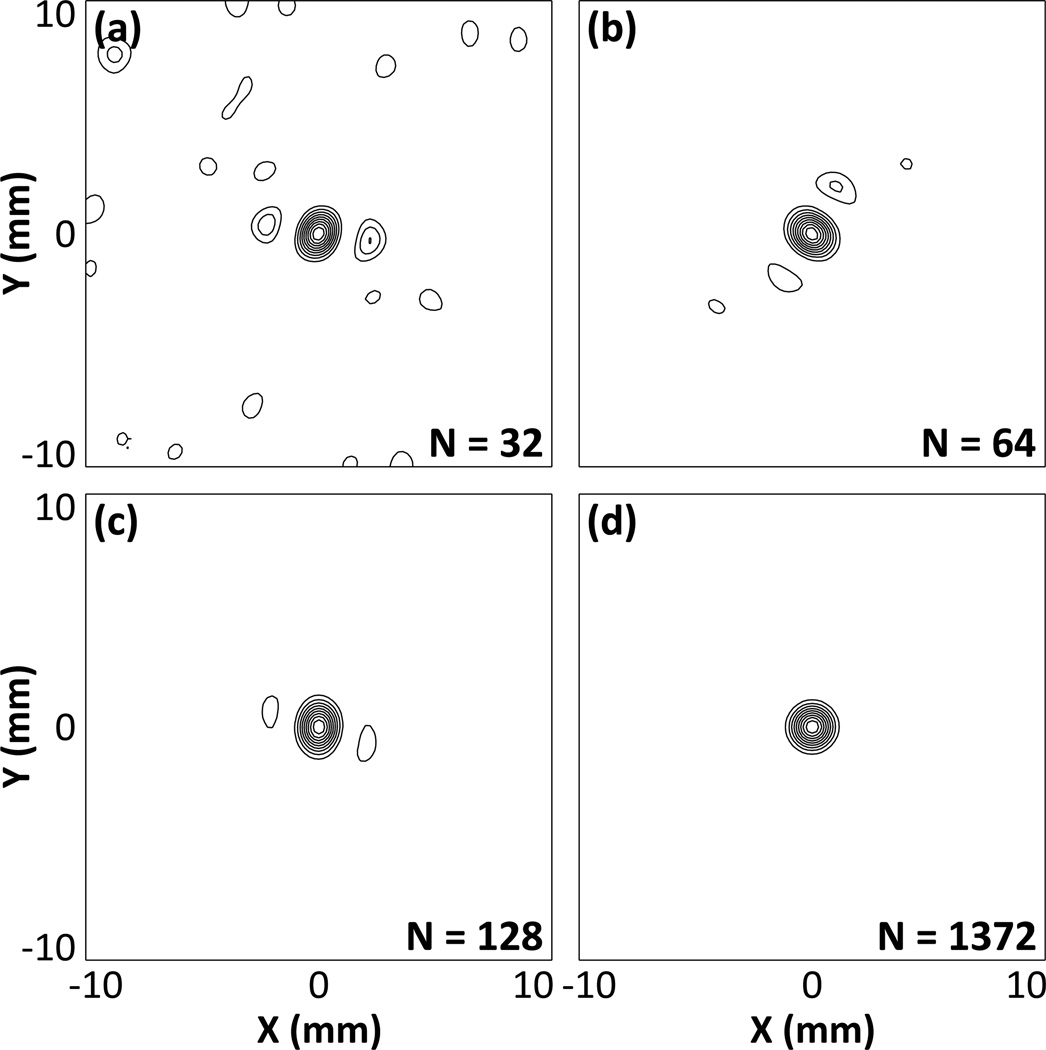
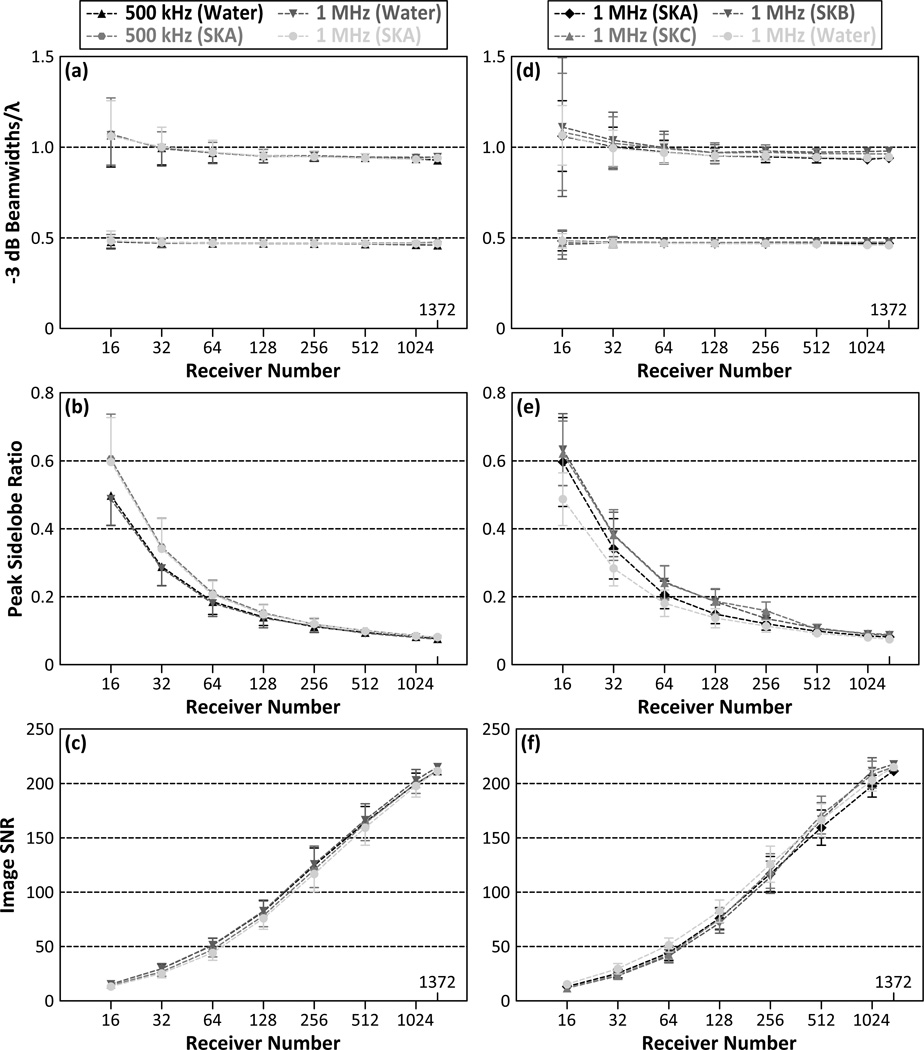
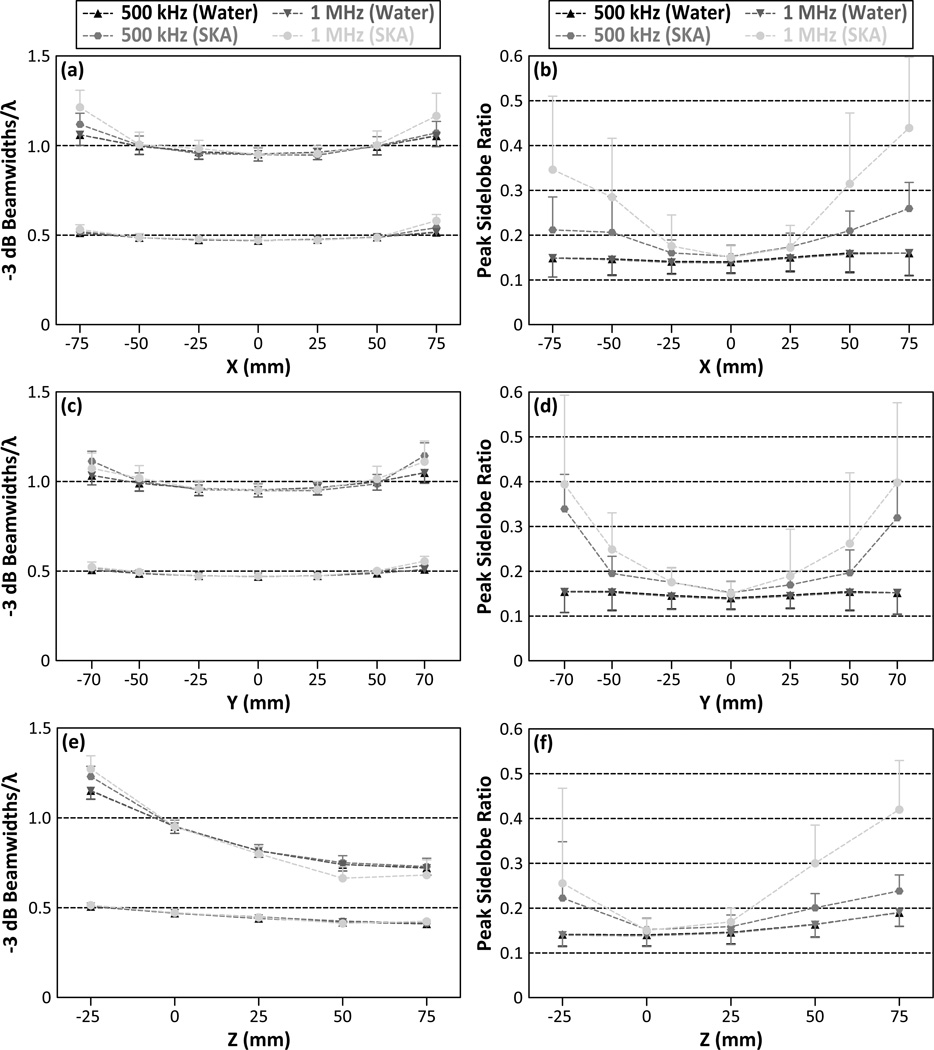
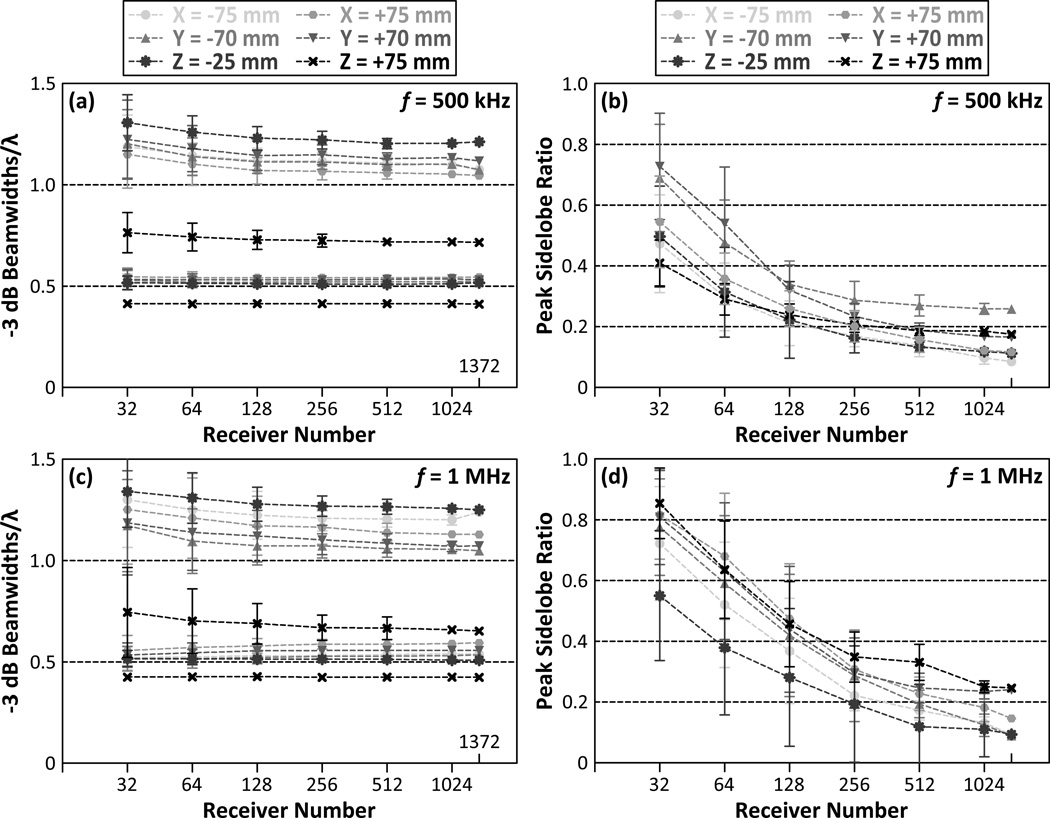
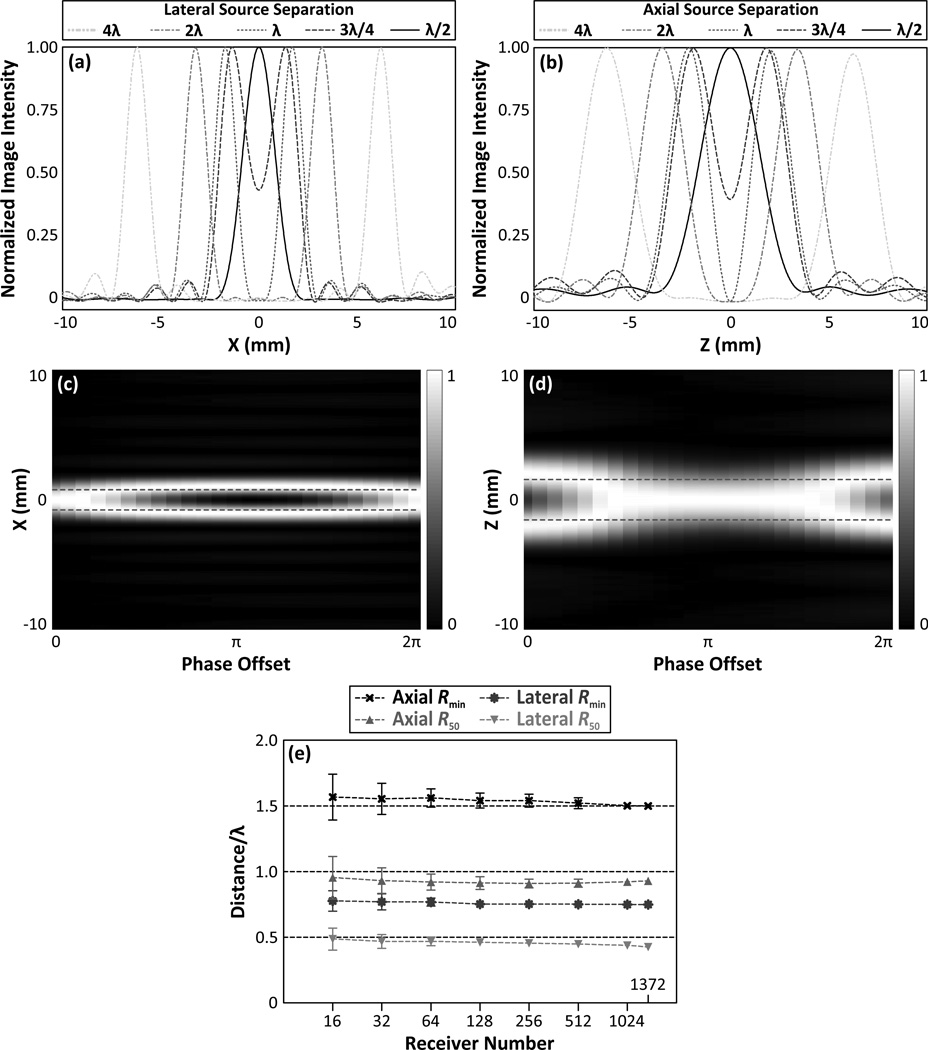
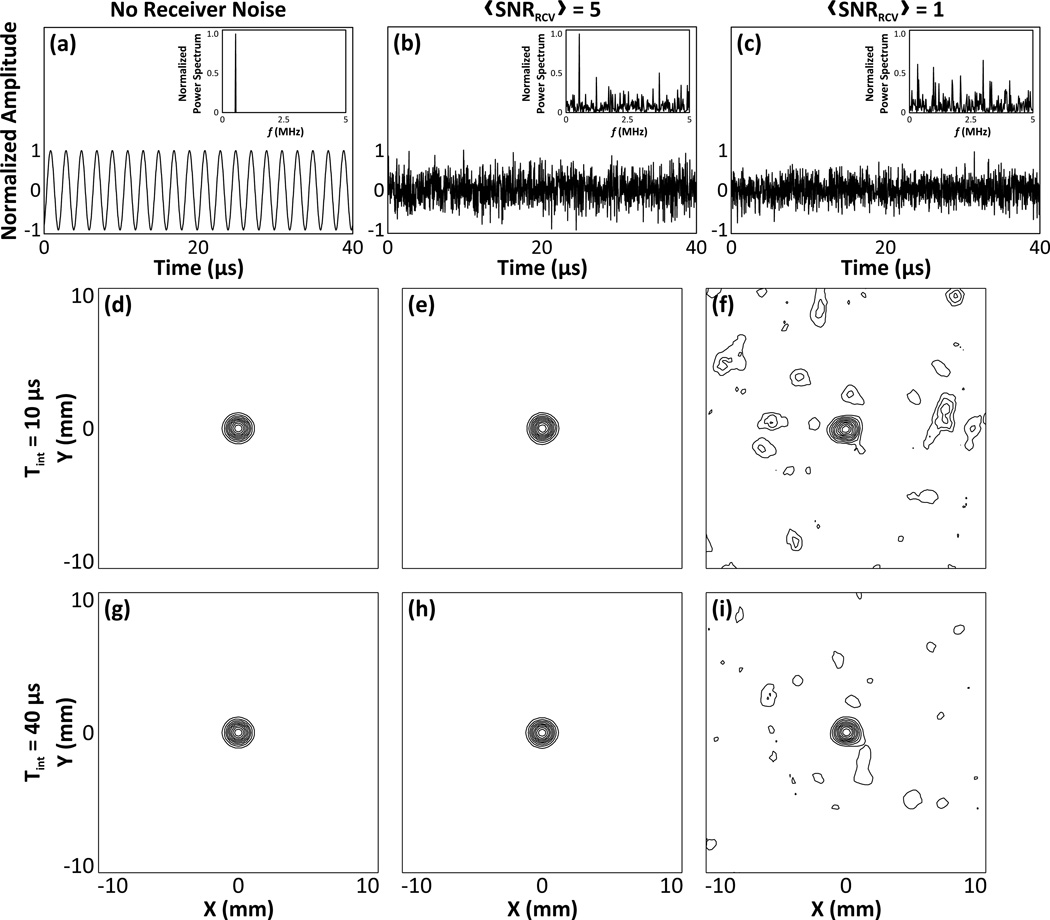
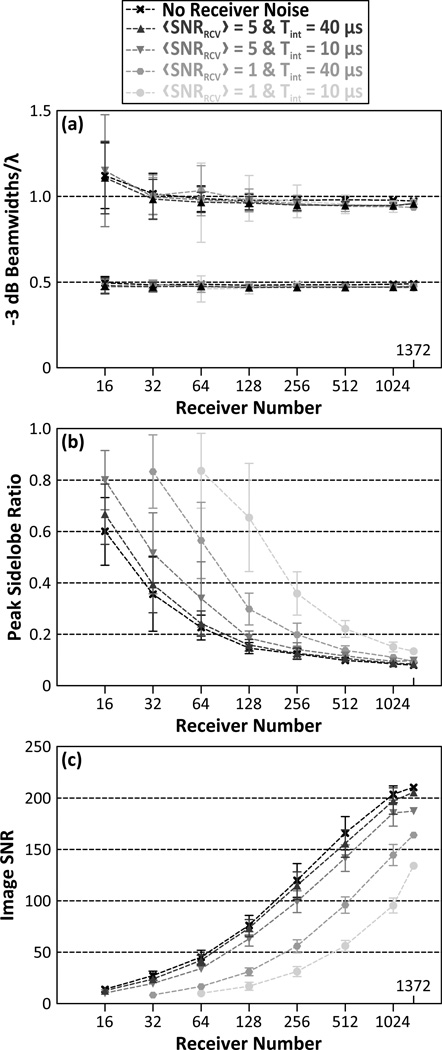
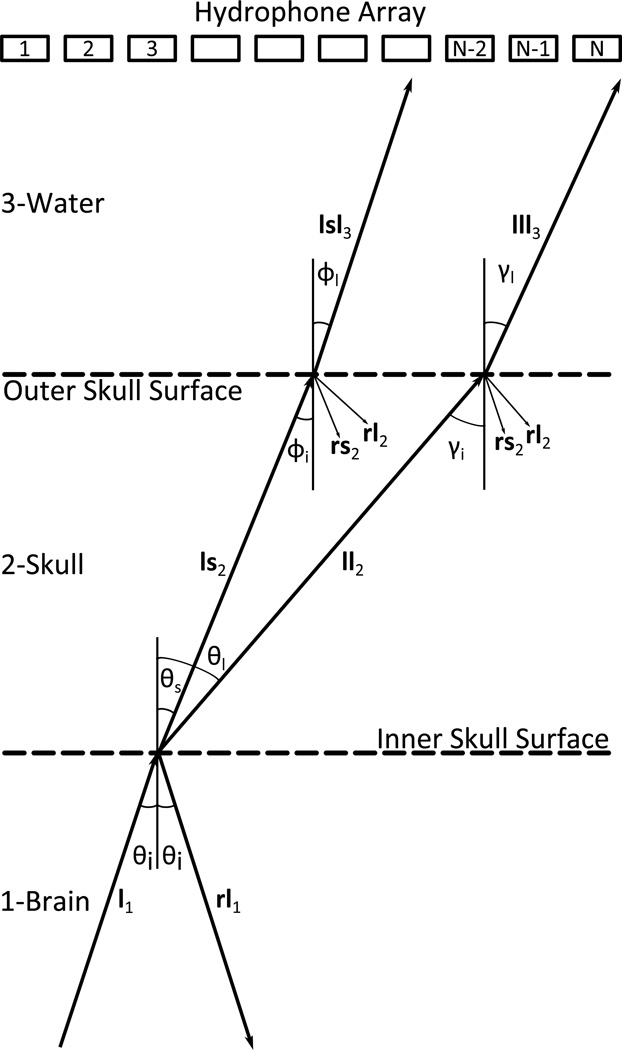
The feasibility of transcranial passive acoustic mapping with hemispherical sparse arrays (30 cm diameter, 16 to 1372 elements, 2.48 mm receiver diameter) using CT-based aberration corrections was investigated via numerical simulations. A multi-layered ray acoustic transcranial ultrasound propagation model based on CT-derived skull morphology was developed. By incorporating skull-specific aberration corrections into a conventional passive beamforming algorithm (Norton and Won 2000 IEEE Trans. Geosci. Remote Sens. 38 1337-43), simulated acoustic source fields representing the emissions from acoustically-stimulated microbubbles were spatially mapped through three digitized human skulls, with the transskull reconstructions closely matching the water-path control images. Image quality was quantified based on main lobe beamwidths, peak sidelobe ratio, and image signal-to-noise ratio. The effects on the resulting image quality of the source's emission frequency and location within the skull cavity, the array sparsity and element configuration, the receiver element sensitivity, and the specific skull morphology were all investigated. The system's resolution capabilities were also estimated for various degrees of array sparsity. Passive imaging of acoustic sources through an intact skull was shown possible with sparse hemispherical imaging arrays. This technique may be useful for the monitoring and control of transcranial focused ultrasound (FUS) treatments, particularly non-thermal, cavitation-mediated applications such as FUS-induced blood-brain barrier disruption or sonothrombolysis, for which no real-time monitoring techniques currently exist.


Figures

Figure 1
Figure 1
Sagittal (a) and coronal (b) views of the hemispherical array, segmented skull surfaces (SKA), and simulated source locations.
Figure 2
Figure 2
−3 dB [(a) and (b)] and −6 dB [(c) and (d)] intensity isosurfaces of passive acoustic maps at each of the 17 source locations investigated within the skull cavity of SKA for a 500 kHz source with [(a) and (c)] and without [(b) and (d)] CT-based skull corrections included in the reconstruction algorithm. The hydrophone array contained 128 elements. The light and dark gray lines represent the inner and outer skull contours of SKA, respectively.
Figure 3
Figure 3
Normalized passive acoustic maps of a 250 kHz [(a), (b), and (c)], 500 kHz [(d), (e), and (f)], and 1 MHz [(g), (h), and (i)] point source located at the geometric focus of the array, reconstructed in water [(a), (d), and (g)], through a human skullcap (SKA) without skull corrections [(b), (e), and (h)], and through a human skullcap (SKA) using CT-based skull corrections [(c), (f), and (i)]. The hydrophone array contained 128 elements. Contours are shown at 10% intervals.
Figure 4
Figure 4
Normalized transcranial (SKA) passive acoustic maps of a simulated 500 kHz point source located at the geometric focus of the array for hydrophone arrays containing 32 (a), 64 (b), 128 (c), and 1372 elements (d). Contours are drawn at 10% intervals.
Figure 5
Figure 5
−3 dB axial (top curves) and lateral (bottom curves) main lobe beamwidths scaled by the corresponding wavelength (a), peak sidelobe ratio (b), and image SNR (c) as a function of receiver element number for 500 kHz and 1 MHz point sources located at the geometric focus of the array. The same metrics are plotted for 1 MHz sources in [(d), (e), and (f)] for three different skull specimens (SKA, SKB, SKC). Transcranial and water-path reconstruction cases are shown. The results shown in the left (right) column are averaged over 500 (100) receiver configurations per population fraction. Error bars indicate one standard deviation for the different receiver configurations.
Figure 6
Figure 6
−3 dB axial (top curves) and lateral (bottom curves) main lobe beamwidths scaled by the corresponding wavelength [(a), (c), and (e)] and peak sidelobe ratio [(b), (d), and (f)] as a function of source location for 500 kHz and 1 MHz point sources. Transcranial (SKA) and water-path reconstruction cases are shown. The results are averaged over 500 hydrophone arrays each containing 128 elements. One-sided error bars indicate one standard deviation for the different receiver configurations.
Figure 7
Figure 7
−3 dB axial (top curves) and lateral (bottom curves) main lobe beamwidths scaled by the corresponding wavelength [(a) and (c)], and peak sidelobe ratio [(b) and (d)] as a function of receiver element number for 500 kHz and 1 MHz point sources located at points farthest away from the array’s geometric focus. Results from the transcranial (SKA) reconstruction case are shown. The results are averaged over 500 receiver configurations per population fraction. Error bars indicate one standard deviation for the different receiver configurations.
Figure 8
Figure 8
Line profiles of the transcranial (SKA) passive acoustic maps of two in-phase, equal amplitude 500 kHz sources separated laterally (a) and axially (b) about the geometric focus of the array by various distances. Line profiles of the transcranial passive acoustic maps of two 500 kHz sources separated by λ/2 (1.55 mm) laterally (c) and λ (3.09 mm) axially (d) about the array’s geometric focus as a function of the inter-source phase offset (dashed red lines indicate actual source locations). The hydrophone array for plots (a), (b), (c), and (d) contained 128 elements. Axial and lateral axial Rmin and R50 distances as a function of receiver element number for transcranial image reconstruction (e). The results are averaged over 100 receiver configurations per population fraction. Error bars indicate one standard deviation for the different receiver configurations.
Figure 9
Figure 9
Examples of single channel signals due to a 500 kHz source located at the array’s geometric focus with no noise (a), and with low (b) and high (c) amounts of additive noise. The normalized power spectra of each case is plotted as an inset. Transcranial (SKA) passive acoustic maps generated by beamforming the filtered signals with an integration time of 10 µs for the no noise (d), low noise (e), and high noise (f) cases are shown. Corresponding images generated with an integration time of 40 µs are shown in (g), (h), and (i). All of the images were reconstructed with a hydrophone array containing 128 elements. Contours are drawn at 10% intervals.
Figure 10
Figure 10
−3 dB axial (top curves) and lateral (bottom curves) main lobe beamwidths scaled by the corresponding wavelength (a), peak sidelobe ratio (b), and image SNR (c) as a function of receiver element number for a 500 kHz point source located at the geometric focus of the array. Results from transcranial (SKA) reconstructions for each combination of receiver noise level and integration time are shown. The results are averaged over 50 receiver configurations per population fraction. Error bars indicate one standard deviation for the different receiver configurations.
Figure A1
Figure A1
Schematic of the 3-layered sound transmission through the skull. Sound is transmitted from medium 1 (brain) to medium 3 (water) through medium 2 (skull). The hydrophone array and skull surfaces are shown as parallel for illustrative purposes only. A longitudinal wave incident upon the inner skull surface will generate one reflected longitudinal wave and two transmitted waves: one longitudinal and one shear. The transmitted waves follows independent paths to the outer skull surface, at which point each component will give rise to a transmitted longitudinal wave and two reflected waves: one longitudinal and one shear.

References

    1. Alexandrov AV, Molina CA, Grotta JC, Garami Z, Ford S, Alvarez-Sabin J, Montaner J, Saqqur M, Demchuk AM, Moyé LA, Hill MD, Wojner AW. Ultrasound-enhanced thrombolysis for acute ischemic stroke. New England Journal of Medicine. 2004;14(2):113–117. - PubMed
    1. Arvanitis CD, Livingstone MS, Vykhodtseva N, McDannold N. Controlled ultrasound-induced blood-brain barrier disruption using passive acoustic emissions monitoring. Public Library of Science ONE. 2012;7(9):e45783. - PMC - PubMed
    1. Aubry J-F, Tanter M, Gerber J, Thomas J-L, Fink M. Optimal focusing by spatio-temporal inverse filter. II. Experiments. Application to focusing through absorbing and reverberating media. Journal of the Acoustical Society of America. 2001;110(1):48–58. - PubMed
    1. Aubry J-F, Tanter M, Pernot M, Thomas J-L, Fink M. Experimental demonstration of noninvasive transskull adaptive focusing based on prior computed tomography scans. Journal of the Acoustical Society of America. 2003;113(1):84–93. - PubMed
    1. Baron C, Aubry J-F, Tanter M, Meairs S, Fink M. Simulation of intracranial acoustic fields in clinical trials of sonothrombolysis. Ultrasound in Medicine & Biology. 2009;35(7):1148–1158. - PubMed

Publication types