

ADVICE: a new approach for near-real-time monitoring of surface displacements in landslide hazard scenarios
- PMID: 23807688
- PMCID: PMC3758594
- DOI: 10.3390/s130708285
ADVICE: a new approach for near-real-time monitoring of surface displacements in landslide hazard scenarios
Abstract
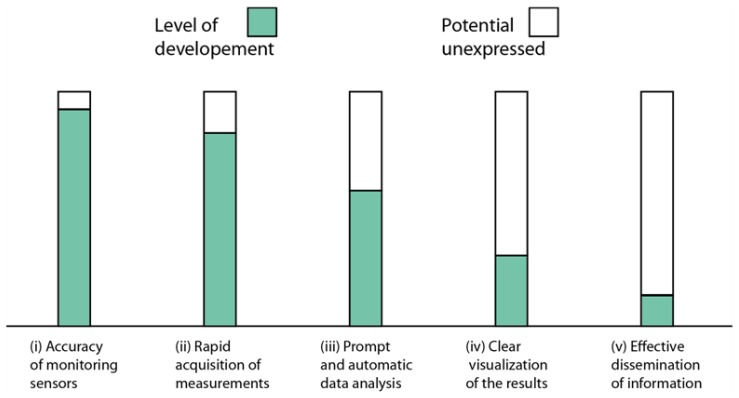
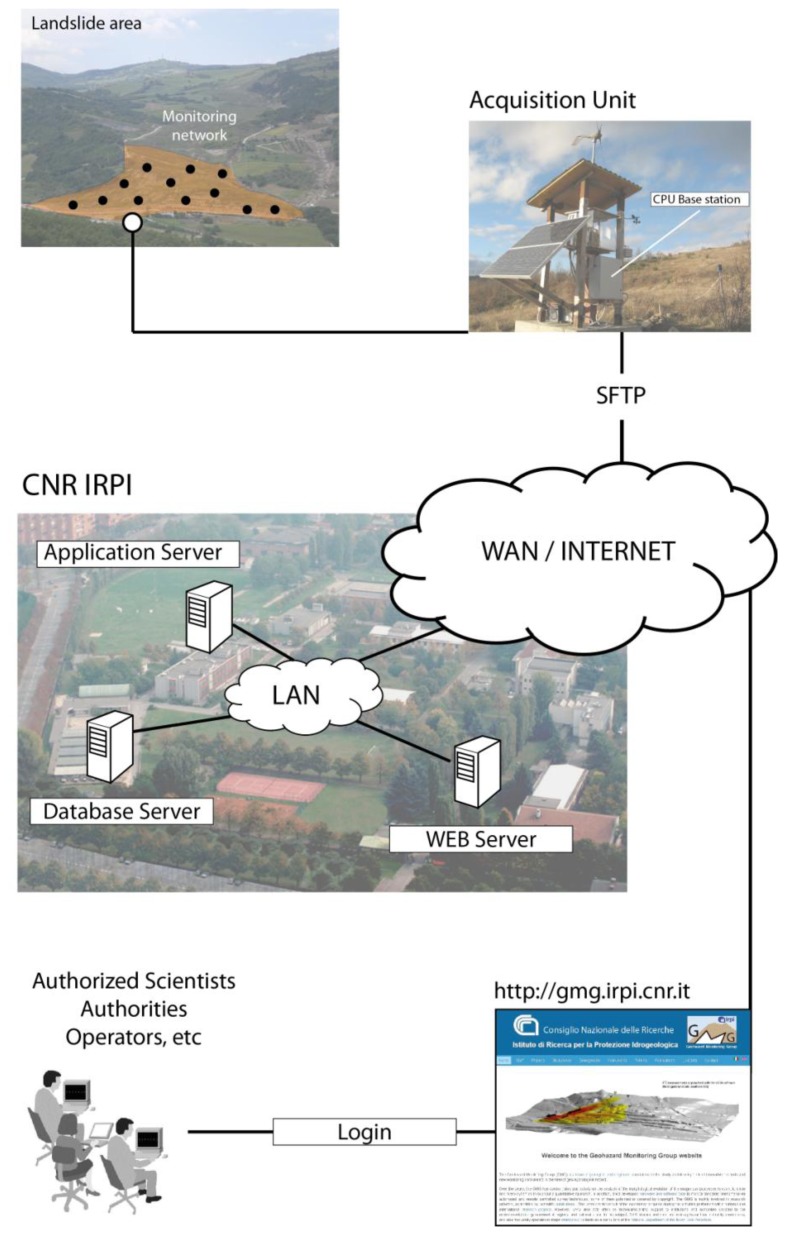
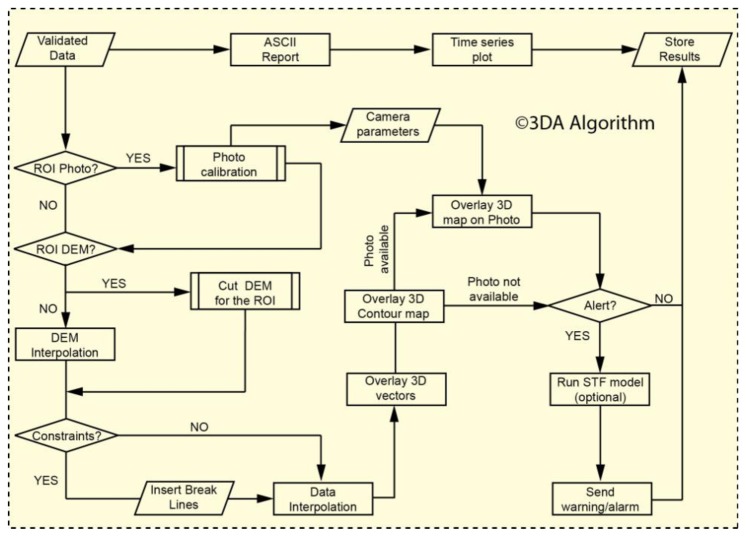
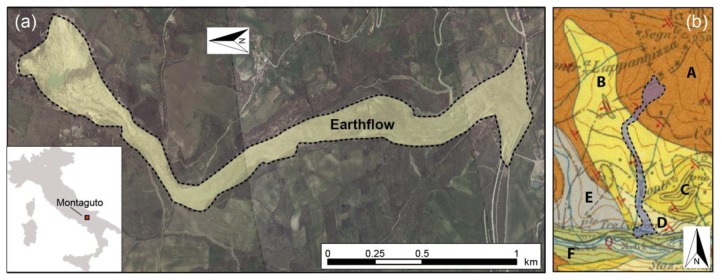
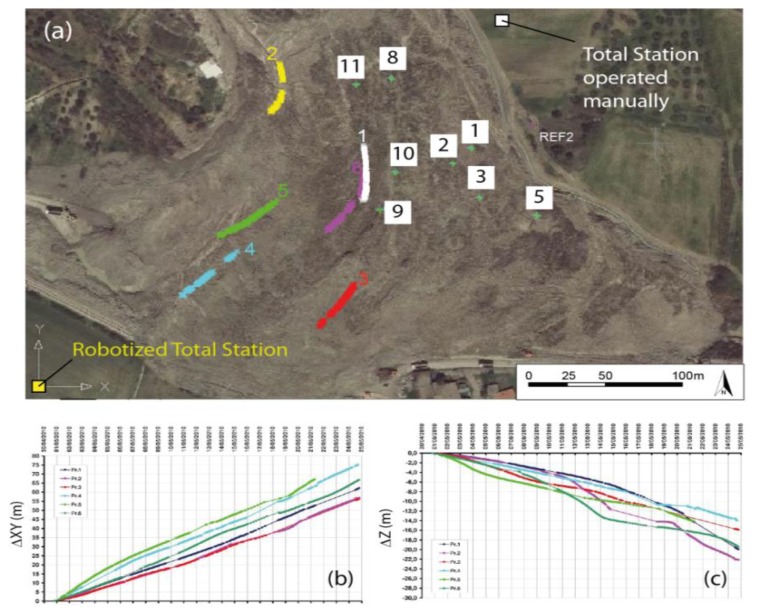
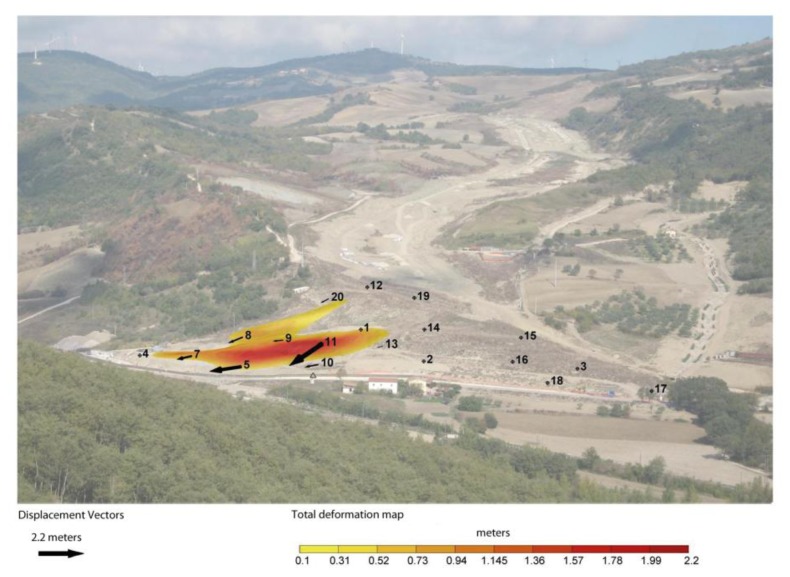
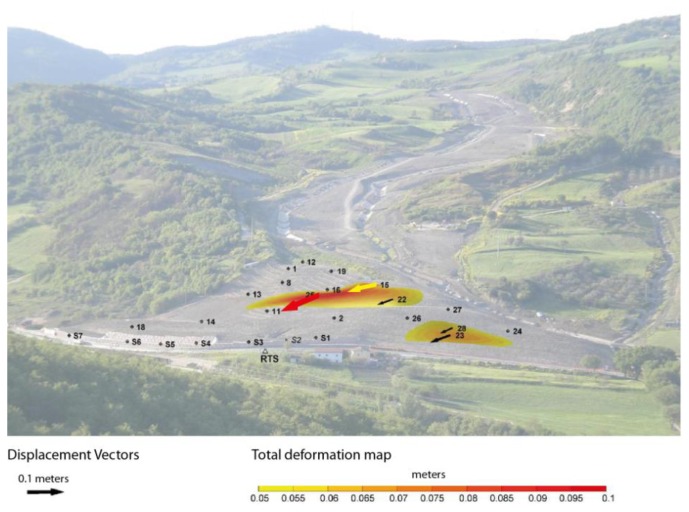
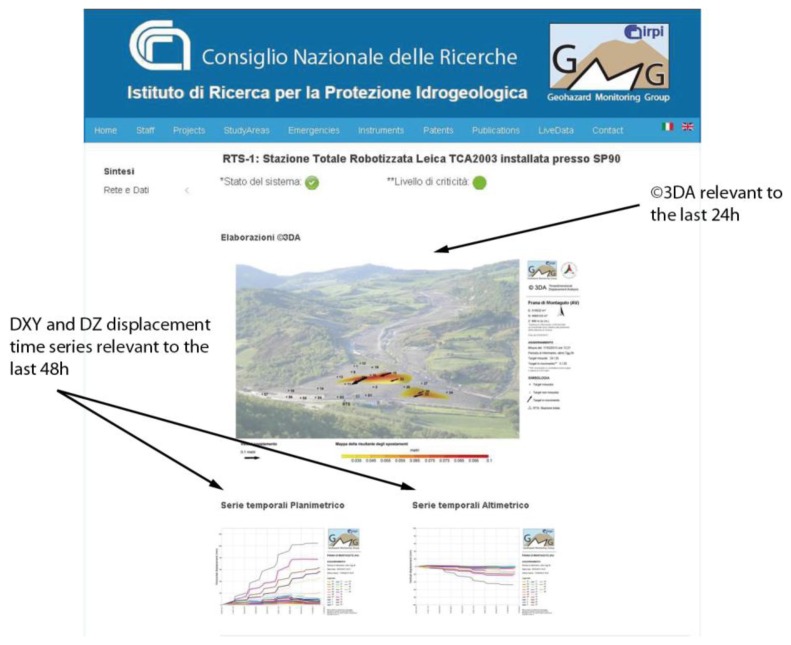
We present a new method for near-real-time monitoring of surface displacements due to landslide phenomena, namely ADVanced dIsplaCement monitoring system for Early warning (ADVICE). The procedure includes: (i) data acquisition and transfer protocols; (ii) data collection, filtering, and validation; (iii) data analysis and restitution through a set of dedicated software; (iv) recognition of displacement/velocity threshold, early warning messages via SMS and/or emails; (v) automatic publication of the results on a dedicated webpage. We show how the system evolved and the results obtained by applying ADVICE over three years into a real early warning scenario relevant to a large earthflow located in southern Italy. ADVICE has speed-up and facilitated the understanding of the landslide phenomenon, the communication of the monitoring results to the partners, and consequently the decision-making process in a critical scenario. Our work might have potential applications not only for landslide monitoring but also in other contexts, as monitoring of other geohazards and of complex infrastructures, as open-pit mines, buildings, dams, etc.
Figures


Similar articles
-
Landslide hazard early warning method for rock slopes using a hybrid LSTM-SARIMA data-driven model.PLoS One. 2025 May 23;20(5):e0323650. doi: 10.1371/journal.pone.0323650. eCollection 2025. PLoS One. 2025. PMID: 40408529 Free PMC article.
-
Real time remote monitoring and pre-warning system for Highway landslide in mountain area.J Environ Sci (China). 2011 Jun;23 Suppl:S100-5. doi: 10.1016/S1001-0742(11)61087-5. J Environ Sci (China). 2011. PMID: 25084567
-
A Fast Deploying Monitoring and Real-Time Early Warning System for the Baige Landslide in Tibet, China.Sensors (Basel). 2020 Nov 19;20(22):6619. doi: 10.3390/s20226619. Sensors (Basel). 2020. PMID: 33228127 Free PMC article.
-
A review on drone-based harmful algae blooms monitoring.Environ Monit Assess. 2019 Mar 9;191(4):211. doi: 10.1007/s10661-019-7365-8. Environ Monit Assess. 2019. PMID: 30852736 Review.
-
Biomedical engineering's contribution to defending the homeland.IEEE Eng Med Biol Mag. 2004 Jan-Feb;23(1):175-86. doi: 10.1109/memb.2004.1297190. IEEE Eng Med Biol Mag. 2004. PMID: 15154275 Review. No abstract available.
Cited by
-
Statistical Time-Series Analysis of Interferometric Coherence from Sentinel-1 Sensors for Landslide Detection and Early Warning.Sensors (Basel). 2021 Oct 13;21(20):6799. doi: 10.3390/s21206799. Sensors (Basel). 2021. PMID: 34696012 Free PMC article.
-
Advantages of IoT-Based Geotechnical Monitoring Systems Integrating Automatic Procedures for Data Acquisition and Elaboration.Sensors (Basel). 2021 Mar 23;21(6):2249. doi: 10.3390/s21062249. Sensors (Basel). 2021. PMID: 33807083 Free PMC article.
References
-
- Petley D. Global patterns of loss of life from landslides. Geology. 2012;40:927–930.
-
- Corsini A., Pasuto A., Soldati M., Zannoni A. Field monitoring of the Corvara landslide (Dolomites, Italy) and its relevance for hazard assessment. Geomorphology. 2005;66:149–165.
-
- Revellino P., Grelle G., Donnarumma A., Guadagno F.M. Structurally controlled earth flows of the Benevento province (Southern Italy) Bull. Eng. Geol. Environ. 2010;69:487–500.
-
- Wieczorek G.F., Snyder J.B. Monitoring Slope Movements. In: Young R., Norby L., editors. Geololgical Monitoring. Geological Society of America; Boulder, CO, USA: 2009. pp. 245–271.
-
- Tarchi D., Casagli N., Fanti R., Leva D.D., Luzi G., Pasuto A., Pieraccini M., Silvano S. Landslide monitoring by using ground-based SAR interferometry: An example of application to the Tessina landslide in Italy. Eng. Geol. 2003;68:15–30.
Publication types
MeSH terms
LinkOut - more resources
Full Text Sources
Other Literature Sources
