

Evaluating subject-level incremental values of new markers for risk classification rule
- PMID: 23807696
- PMCID: PMC4527584
- DOI: 10.1007/s10985-013-9272-6
Evaluating subject-level incremental values of new markers for risk classification rule
Abstract
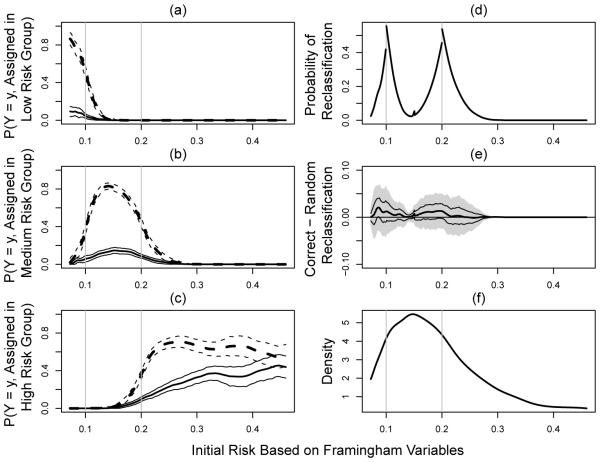
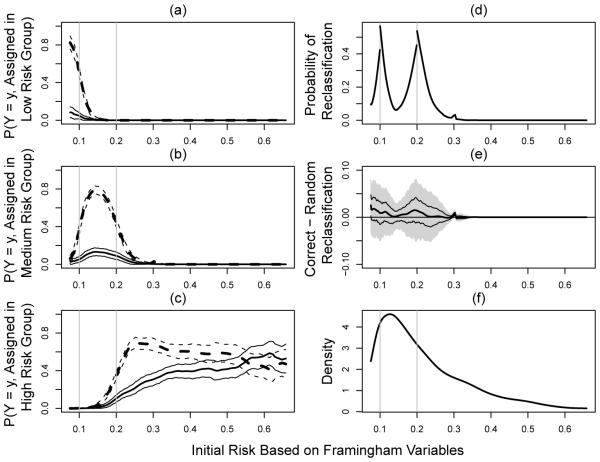
Suppose that we need to classify a population of subjects into several well-defined ordered risk categories for disease prevention or management with their "baseline" risk factors/markers. In this article, we present a systematic approach to identify subjects using their conventional risk factors/markers who would benefit from a new set of risk markers for more accurate classification. Specifically for each subgroup of individuals with the same conventional risk estimate, we present inference procedures for the reclassification and the corresponding correct re-categorization rates with the new markers. We then apply these new tools to analyze the data from the Cardiovascular Health Study sponsored by the US National Heart, Lung, and Blood Institute. We used Framingham risk factors plus the information of baseline anti-hypertensive drug usage to identify adult American women who may benefit from the measurement of a new blood biomarker, CRP, for better risk classification in order to intensify prevention of coronary heart disease for the subsequent 10 years.
Figures
References
-
- Bickel PJ, Rosenblatt M. On some global measures of the deviations of density function estimates. The Annals of Statistics. 1973;1:1071–1095.
-
- Buring J, Hennekens C. The Women’s Health Study: summary of the study design. Journal of Myocardial Ischemia. 1992;4:27–9.
-
- Chi Y, Zhou X. The need for reorientation toward cost-effective prediction: Comments on ‘Evaluating the added predictive ability of a new marker: From area under the ROC curve to reclassification and beyond’ by Pencina et al (2008) Statistics in Medicine. 2008;27(2):182–184. - PubMed
-
- Cook N. Use and misuse of the receiver operating characteristic curve in risk prediction. Circulation. 2007;115(7):928. - PubMed
-
- Cook N. Comments on ‘Evaluating the added predictive ability of a new marker: From area under the ROC curve to reclassification and beyond’ by Pencina et al (2008) Statistics in Medicine. 2008;27(2):191–195. - PubMed
Publication types
MeSH terms
Substances
Grants and funding
- N01 HC085080/HL/NHLBI NIH HHS/United States
- U01 HL080295/HL/NHLBI NIH HHS/United States
- N01 HC085082/HL/NHLBI NIH HHS/United States
- HHSN268201200036C/HL/NHLBI NIH HHS/United States
- N01 HC055222/HL/NHLBI NIH HHS/United States
- N01 HC085079/HL/NHLBI NIH HHS/United States
- R21 HL085375/HL/NHLBI NIH HHS/United States
- R01 AG023629/AG/NIA NIH HHS/United States
- N01 HC085081/HL/NHLBI NIH HHS/United States
- HHSN268200800007C/HL/NHLBI NIH HHS/United States
- N01 HC085086/HL/NHLBI NIH HHS/United States
- N01 HC085083/HL/NHLBI NIH HHS/United States
LinkOut - more resources
Full Text Sources
Other Literature Sources
Research Materials
Miscellaneous
