Effect of Green Tea Extract/Poly-γ-Glutamic Acid Complex in Obese Type 2 Diabetic Mice
- PMID: 23807923
- PMCID: PMC3689017
- DOI: 10.4093/dmj.2013.37.3.196
Effect of Green Tea Extract/Poly-γ-Glutamic Acid Complex in Obese Type 2 Diabetic Mice
Abstract
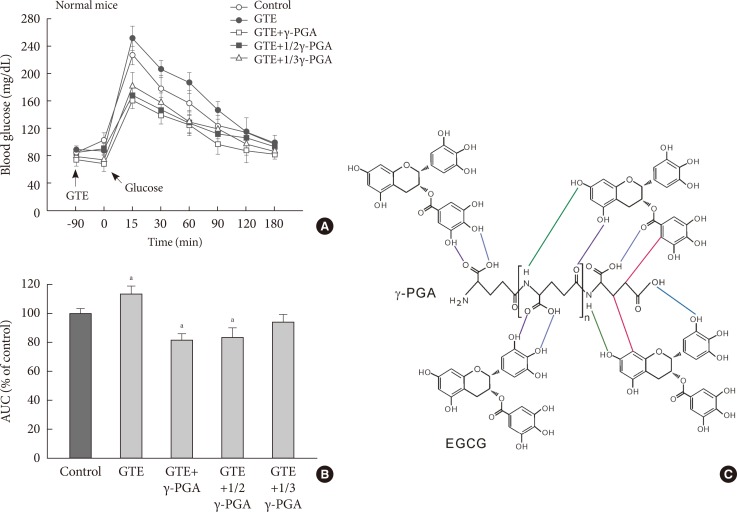
Background: The increasing prevalence of type 2 diabetes mellitus (T2DM) is associated with the rapid spread of obesity. Obesity induces insulin resistance, resulting in β-cell dysfunction and thus T2DM. Green tea extract (GTE) has been known to prevent obesity and T2DM, but this effect is still being debated. Our previous results suggested that circulating green tea gallated catechins (GCs) hinders postprandial blood glucose lowering, regardless of reducing glucose and cholesterol absorption when GCs are present in the intestinal lumen. This study aimed to compare the effect of GTE with that of GTE coadministered with poly-γ-glutamic acid (γ-PGA), which is likely to inhibit the intestinal absorption of GCs.
Methods: The db/db mice and age-matched nondiabetic mice were provided with normal chow diet containing GTE (1%), γ-PGA (0.1%), or GTE+γ-PGA (1%:0.1%) for 4 weeks.
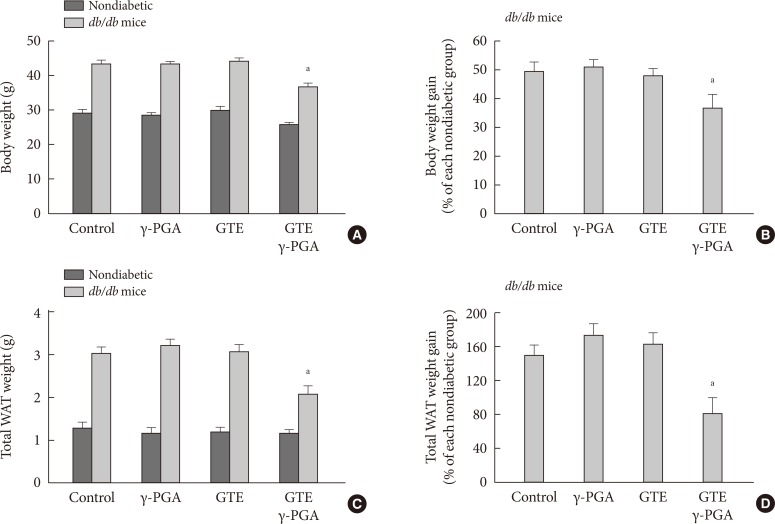
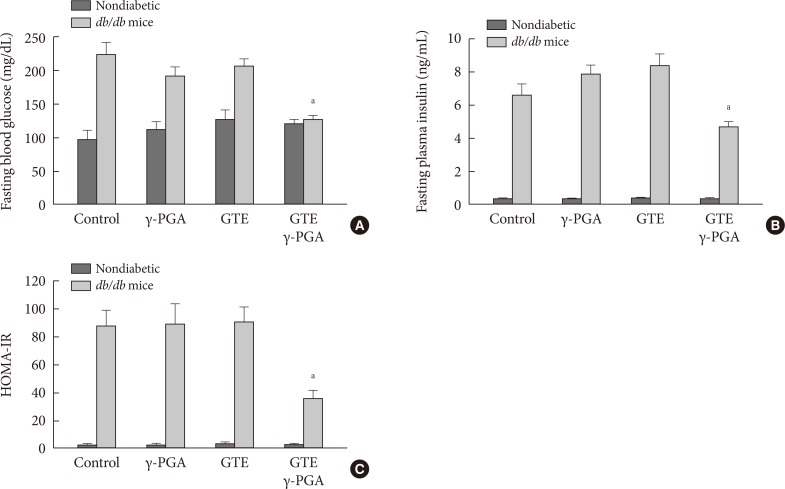
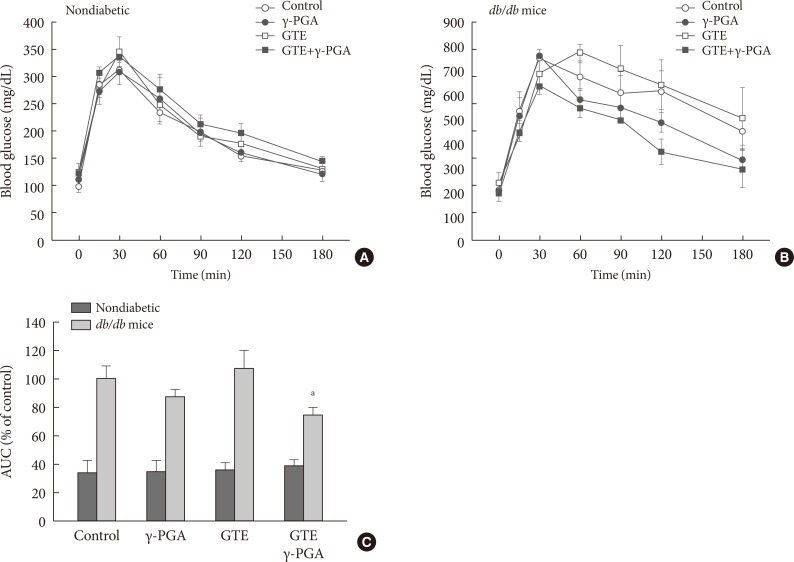
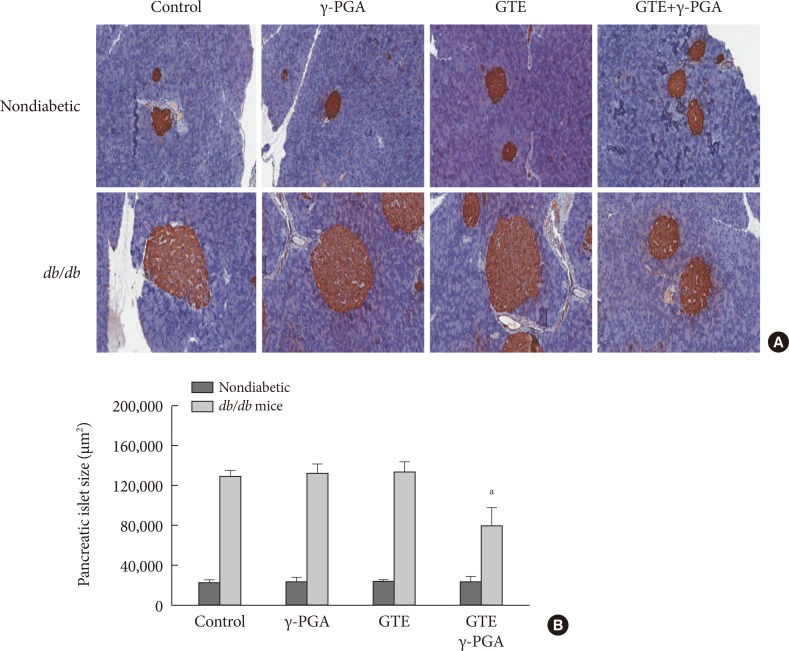
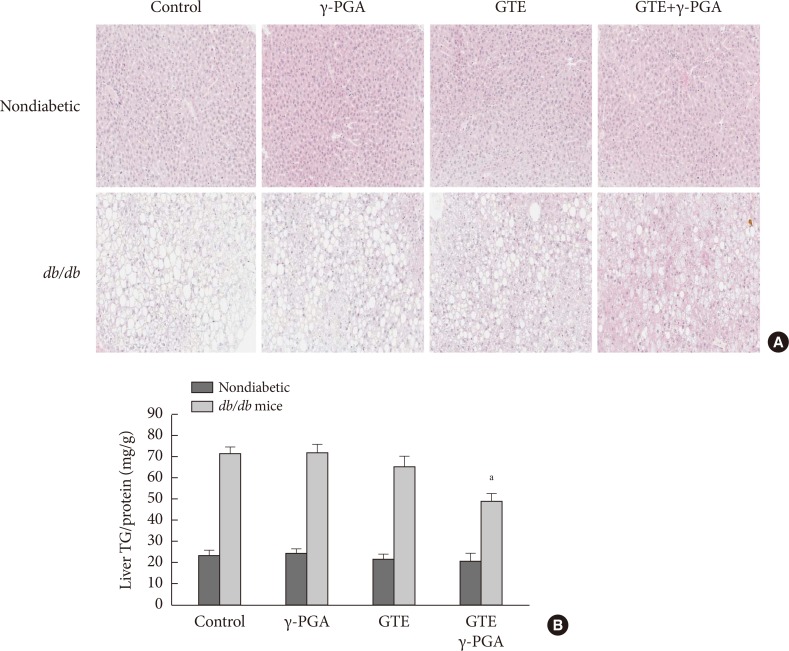
Results: In nondiabetic mice, none of the drugs showed any effects after 4 weeks. In db/db mice, however, weight gain and body fat gain were significantly reduced in the GTE+γ-PGA group compared to nondrug-treated db/db control mice without the corresponding changes in food intake and appetite. Glucose intolerance was also ameliorated in the GTE+γ-PGA group. Histopathological analyses showed that GTE+γ-PGA-treated db/db mice had a significantly reduced incidence of fatty liver and decreased pancreatic islet size. Neither GTE nor γ-PGA treatment showed any significant results.
Conclusion: These results suggest that GTE+γ-PGA treatment than GTE or γ-PGA alone may be a useful tool for preventing both obesity and obesity-induced T2DM.
Keywords: Diabetes mellitus, type 2; Gallated catechins; Glucose intolerance; Obesity; Poly-γ-glutamic acid; db/db mice.
Conflict of interest statement
No potential conflict of interest relevant to this article was reported.
Figures
Similar articles
-
Green tea extract with polyethylene glycol-3350 reduces body weight and improves glucose tolerance in db/db and high-fat diet mice.Naunyn Schmiedebergs Arch Pharmacol. 2013 Aug;386(8):733-45. doi: 10.1007/s00210-013-0869-9. Epub 2013 Apr 27. Naunyn Schmiedebergs Arch Pharmacol. 2013. PMID: 23620335
-
Green tea extract co-administered with a polymer effectively prevents alcoholic liver damage by prolonged inhibition of alcohol absorption in mice.Alcohol Alcohol. 2013 Jan-Feb;48(1):59-67. doi: 10.1093/alcalc/ags118. Epub 2012 Nov 7. Alcohol Alcohol. 2013. PMID: 23136046
-
Ambivalent role of gallated catechins in glucose tolerance in humans: a novel insight into non-absorbable gallated catechin-derived inhibitors of glucose absorption.J Physiol Pharmacol. 2009 Dec;60(4):101-9. J Physiol Pharmacol. 2009. PMID: 20065503
-
Effect of green tea extract on lipid profile in patients with type 2 diabetes mellitus: A systematic review and meta-analysis.Diabetes Metab Syndr. 2020 Jul-Aug;14(4):293-301. doi: 10.1016/j.dsx.2020.03.018. Epub 2020 Apr 5. Diabetes Metab Syndr. 2020. PMID: 32289742
-
Green tea extract and the risk of drug-induced liver injury.Expert Opin Drug Metab Toxicol. 2014 Dec;10(12):1663-76. doi: 10.1517/17425255.2014.971011. Epub 2014 Oct 15. Expert Opin Drug Metab Toxicol. 2014. PMID: 25316200 Review.
Cited by
-
γ-PGA-Rich Chungkookjang, Short-Term Fermented Soybeans: Prevents Memory Impairment by Modulating Brain Insulin Sensitivity, Neuro-Inflammation, and the Gut-Microbiome-Brain Axis.Foods. 2021 Jan 21;10(2):221. doi: 10.3390/foods10020221. Foods. 2021. PMID: 33494481 Free PMC article. Review.
-
Preparation of Type-A Gelatin/Poly-γ-Glutamic Acid Nanoparticles for Enhancing the Stability and Bioavailability of (-)-Epigallocatechin Gallate.Foods. 2023 Apr 23;12(9):1748. doi: 10.3390/foods12091748. Foods. 2023. PMID: 37174287 Free PMC article.
-
Coffee but not green tea consumption is associated with prevalence and severity of hepatic steatosis: the impact on leptin level.Eur J Clin Nutr. 2015 Sep;69(9):1023-7. doi: 10.1038/ejcn.2015.23. Epub 2015 Mar 25. Eur J Clin Nutr. 2015. PMID: 25804274
-
Role of PCK1 gene on oil tea-induced glucose homeostasis and type 2 diabetes: an animal experiment and a case-control study.Nutr Metab (Lond). 2019 Feb 13;16:12. doi: 10.1186/s12986-019-0337-8. eCollection 2019. Nutr Metab (Lond). 2019. PMID: 30805021 Free PMC article.
-
Nutrigenomics and its Impact on Life Style Associated Metabolic Diseases.Curr Genomics. 2016 Jun;17(3):261-78. doi: 10.2174/1389202917666160202220422. Curr Genomics. 2016. PMID: 27252592 Free PMC article.
References
-
- Rossner S. Obesity: the disease of the twenty-first century. Int J Obes Relat Metab Disord. 2002;26(Suppl 4):S2–S4. - PubMed
-
- Mokdad AH, Bowman BA, Ford ES, Vinicor F, Marks JS, Koplan JP. The continuing epidemics of obesity and diabetes in the United States. JAMA. 2001;286:1195–1200. - PubMed
-
- Kahn SE, Prigeon RL, McCulloch DK, Boyko EJ, Bergman RN, Schwartz MW, Neifing JL, Ward WK, Beard JC, Palmer JP. Quantification of the relationship between insulin sensitivity and beta-cell function in human subjects. Evidence for a hyperbolic function. Diabetes. 1993;42:1663–1672. - PubMed
-
- Perley M, Kipnis DM. Plasma insulin responses to glucose and tolbutamide of normal weight and obese diabetic and nondiabetic subjects. Diabetes. 1966;15:867–874. - PubMed
LinkOut - more resources
Full Text Sources
Other Literature Sources
Medical
Miscellaneous