Review
. 2013:67:417-35.
doi: 10.1146/annurev-micro-092412-155622. Epub 2013 Jun 26.

Biological consequences and advantages of asymmetric bacterial growth

Affiliations
Review

Biological consequences and advantages of asymmetric bacterial growth

David T Kysela et al. Annu Rev Microbiol. 2013.

Abstract

Asymmetries in cell growth and division occur in eukaryotes and prokaryotes alike. Even seemingly simple and morphologically symmetric cell division processes belie inherent underlying asymmetries in the composition of the resulting daughter cells. We consider the types of asymmetry that arise in various bacterial cell growth and division processes, which include both conditionally activated mechanisms and constitutive, hardwired aspects of bacterial life histories. Although asymmetry disposes some cells to the deleterious effects of aging, it may also benefit populations by efficiently purging accumulated damage and rejuvenating newborn cells. Asymmetries may also generate phenotypic variation required for successful exploitation of variable environments, even when extrinsic changes outpace the capacity of cells to sense and respond to challenges. We propose specific experimental approaches to further develop our understanding of the prevalence and the ultimate importance of asymmetric bacterial growth.


Figures
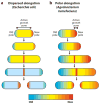
Figure 1
Figure 1
Asymmetry generated during cell growth. (a) During dispersed cell elongation, as in Escherichia coli, new cell material is inserted into the existing network along the lateral sidewall, generating the active growth zone (yellow). The yellow color reflects the mixture of newer and older patches of wall material in the cylindrical sidewall. The cell poles are devoid of new peptidoglycan synthesis, and age during elongation. New peptidoglycan (red) is synthesized at the mid-cell to enable cell division. Following cell division, each daughter cell contains a new pole and an old pole, giving rise to cellular asymmetry. (b) During polar elongation, as in Agrobacterium tumefaciens, new cell wall material is inserted into existing peptidoglycan at the new pole, comprising the active growth zone (red). The old cell pole and cell body are inert, generating a gradient of cell material from old to new. Following elongation, new peptidoglycan (red) is synthesized at the mid-cell to enable cell division. After cell division, one daughter cell inherits newer cell material (orange), whereas the other daughter cell contains old material (blue). Each daughter cell inherits a new pole (red) generated by cell division that is primed for a subsequent round of elongation.
Figure 2
Figure 2
Maintenance of cell shape requires growth patterning that can lead to inherent asymmetries in cell wall architecture and surface patterning. (a) Computational modeling predicts that random insertion of peptidoglycan would lead to rapid loss of cell shape, resulting in bending, cell width fluctuations, and the formation of large pores in the cell wall. (b) In contrast, growth from a pattern of helical segments maintains the rod-like shape. Blue spheres represent fiducial markers labeling a particular site on the cell wall. The model predicts that the cell wall will develop a handedness opposite that of the helical pattern (inset) and that cells will twist with the same handedness as the helical pattern. (c) Wild-type Escherichia coli cells, treated with cephalexin to inhibit cell division, always exhibit a left-handed twist during growth, evidenced by the opposite rotation of the beads bound to each end, demonstrating that the two ends of the cell are rotationally asymmetric with respect to each other. (d) Fluorescent image of an E. coli colony grown from a mixture of cells labeled with different fluorescent proteins. The colony spatially segregates into “sectors” expressing only one of the two neutral markers. The boundaries between the sectors exhibit a tendency to curve in a clockwise direction, indicating that colonies of cells may grow with a preferred handedness and that cellular asymmetries can be transduced to multicellular communities. Black circles indicate the colony boundaries at 12-h time points. Panels a–d modified from References , , , and , respectively. Panel a, copyright 2007, National Academy of Sciences, USA.
Figure 3
Figure 3
Phylogeny of asymmetric growth. Colored labels indicate species with known asymmetric growth patterns, with sites of cell wall growth colored as follows: budding, green; polar/tip growth, red; stalk elongation, purple; sporulation, blue. Topology reflects maximum-likelihood reconstruction of gyrA alleles using the JTT protein substitution matrix and a four-category gamma-distributed model of rate variation plus an additional invariant category (80).
Figure 4
Figure 4
A simplified model of aging by asymmetric damage segregation and accumulation. (a) Symmetric damage segregation yields identical damage levels in both daughter cells. (b) Highly asymmetric damage segregation shunts all damage into one daughter cell, leaving the other daughter free of damage. Both populations start with a single, undamaged cell and experience a net damage increase at the same fixed rate between divisions. This simple model considers no effects of damage until a fatal dose is reached, at which point cells stop dividing altogether. In the case of symmetric damage allocation, each generation experiences an increase in the damage level by one-fourth of the fatal threshold level in all cells. With asymmetric damage segregation, one cell from each daughter pair receives one-half of a fatal damage dose each generation, resulting in rapid deterioration of one daughter (the aging cell) and rejuvenation of the other. After several generations, the symmetric population dies out completely, whereas asymmetric damage segregation ensures continued exponential population expansion.
Figure 5
Figure 5
Simulations of ecological competition demonstrate that a life cycle that includes a mixed strategy of attachment and dispersal is more fit in a fluctuating environment. Individual-based stochastic simulations modeled competition on a lattice of environmental patches. Three different strategies compete: a surface-attached cell with minimal dispersal (blue), a motile cell with no attachment (red), and a mixed-strategy cell that is born motile and later differentiates and attaches (green). White regions remain unoccupied. The mixed strategy mimics the dimorphic bacterium Caulobacter crescentus and incurs a reproductive rate cost relative to that of other strategies, as it achieves reproductive ability only upon development into the attached form. (a) Simulation of a stable environment with constant resource availability in all patches; in 100 simulations, the mixed strategy eventually suffered extinction in all cases. (b) Simulation of a patchy environment in which habitat patches occasionally switch between availability and absence of resources; the mixed strategy achieved fixation in 99 out of 100 simulations. Simulations used a 4 × 4 patch lattice with periodic boundary conditions. Dispersal events occur to one of the four adjacent patches, selected at random. Motile cells disperse at a rate of 0.5 h−1, and attached cells disperse at a rate of 0.001 h−1. The mortality rate was 0.01 h−1 in patches with resources and 0.05 h−1 in the absence of resources. Cell division occurred at a rate of 0.1 h−1, scaled according to a logistic model (40) with a carrying capacity of 100 cells per patch; mixed-strategy cells switch to the attached, reproductive state 3 h after birth. In panel b, patches switch from resource absence to availability at a rate of 0.03 h−1 and in the reverse direction at 0.015 h−1. Initial seeding assigned 400 individuals of each cell type randomly across the lattice. Simulations were updated at 1-h intervals, with birth, death, and dispersal events occurring randomly with a probability determined by the corresponding rate. The metapopulation lattice model takes its general form from Reference . Parameterization of birth and death rates was selected to conform approximately to field observations of naturally occurring Caulobacter species (70).

References

    1. Aaron M, Charbon G, Lam H, Schwarz H, Vollmer W, Jacobs-Wagner C. The tubulin homologue FtsZ contributes to cell elongation by guiding cell wall precursor synthesis in Caulobacter crescentus. Mol Microbiol. 2007;64:938–52. - PubMed
    1. Ackermann M, Chao L, Bergstrom CT, Doebeli M. On the evolutionary origin of aging. Aging Cell. 2007;6:235–44. - PMC - PubMed
    1. Ackermann M, Schauerte A, Stearns SC, Jenal U. Experimental evolution of aging in a bacterium. BMC Evol Biol. 2007;7:126. - PMC - PubMed
    1. Ackermann M, Stearns SC, Jenal U. Senescence in a bacterium with asymmetric division. Science. 2003;300:1920. Conducted experiments in Caulobacter crescentus to provide the first observations of bacterial aging. - PubMed
    1. Aguilaniu H, Gustafsson L, Rigoulet M, Nyström T. Asymmetric inheritance of oxidatively damaged proteins during cytokinesis. Science. 2003;299:1751–53. - PubMed

Publication types