. 2013 Jun 27;38(6):1142-53.
doi: 10.1016/j.immuni.2013.05.016.

K⁺ efflux is the common trigger of NLRP3 inflammasome activation by bacterial toxins and particulate matter

Affiliations

K⁺ efflux is the common trigger of NLRP3 inflammasome activation by bacterial toxins and particulate matter

Raúl Muñoz-Planillo et al. Immunity. .

Abstract

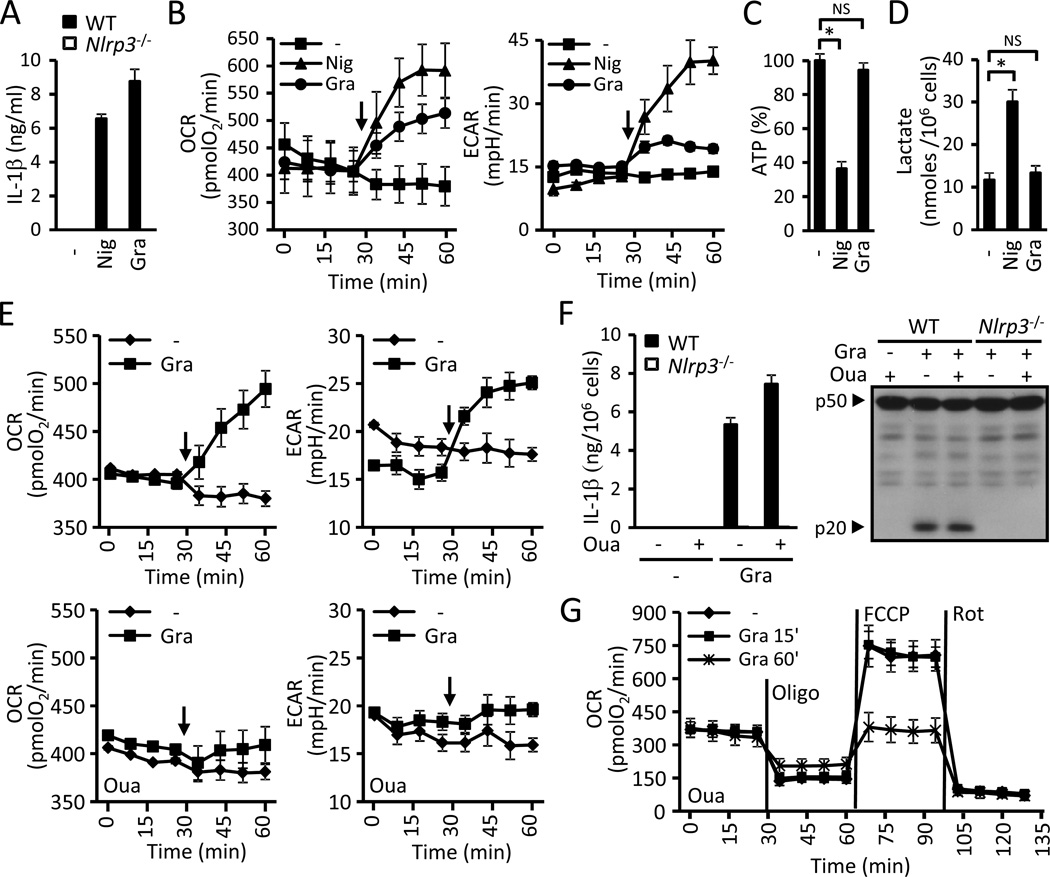
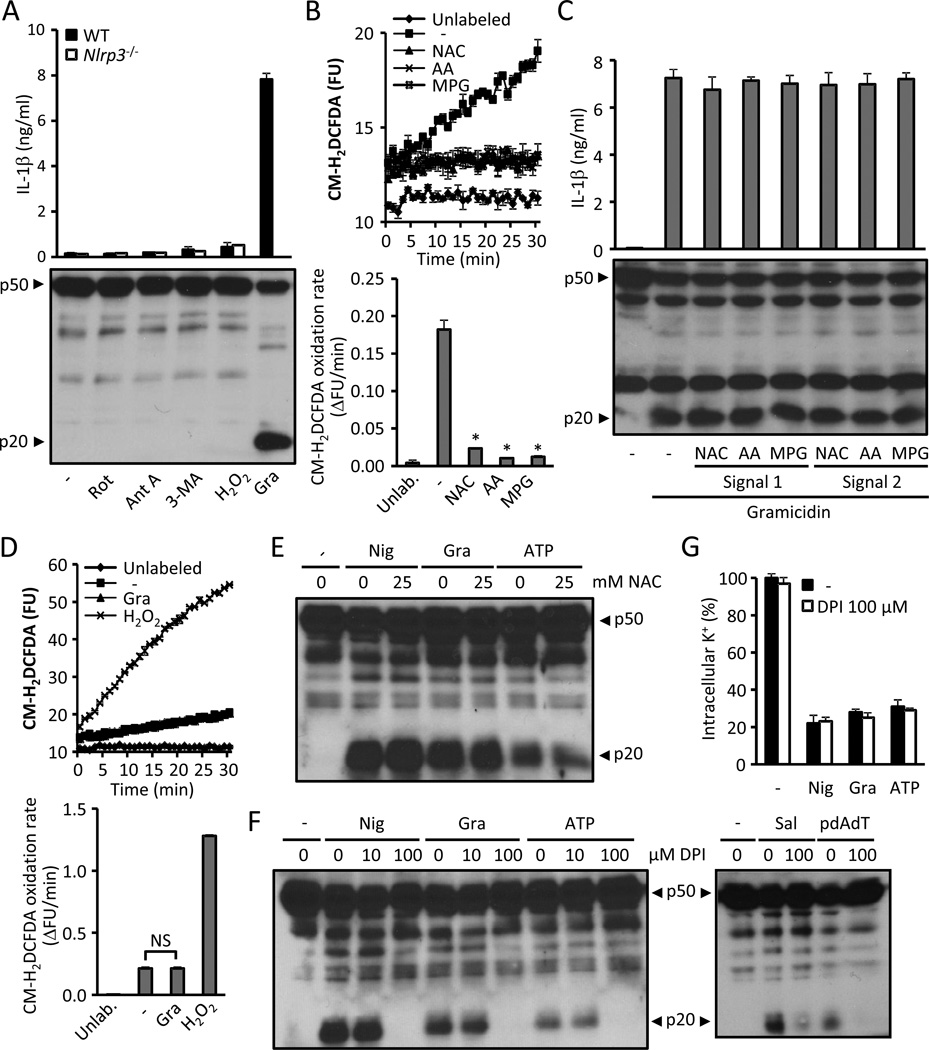
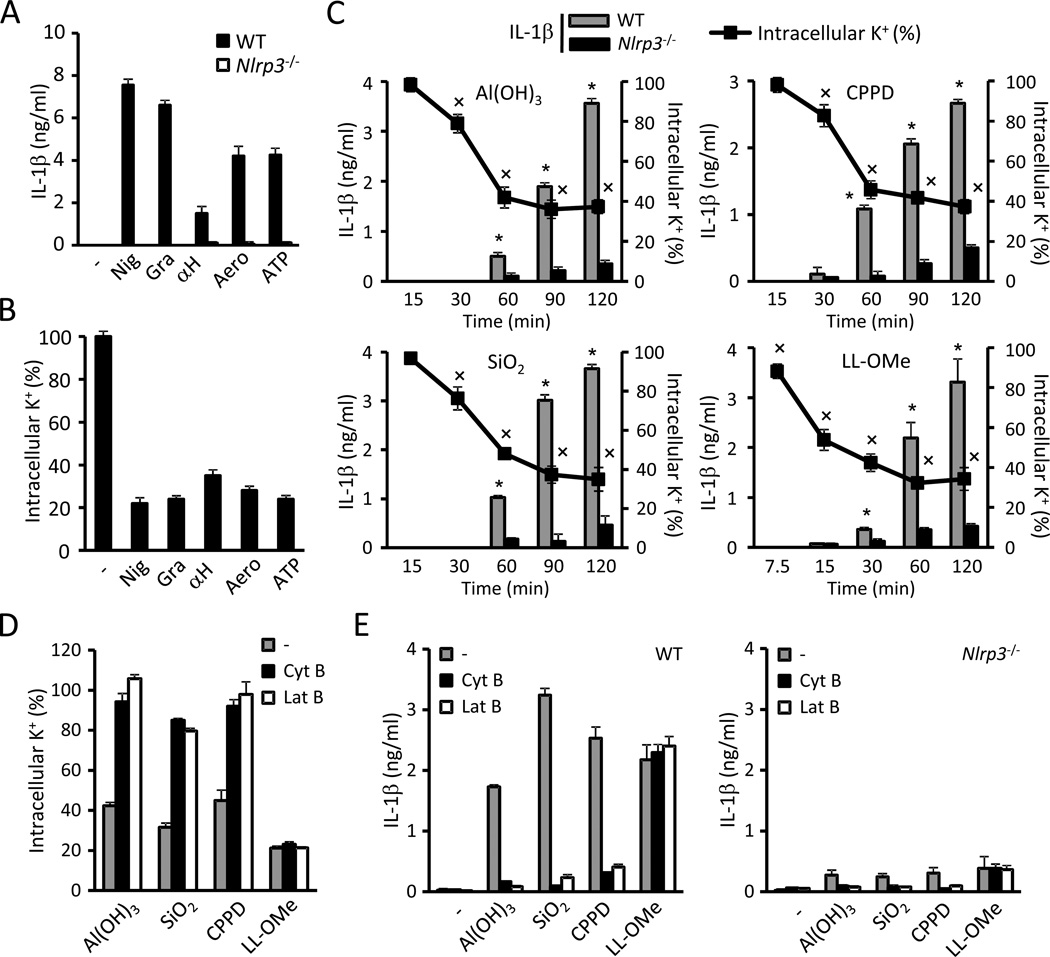
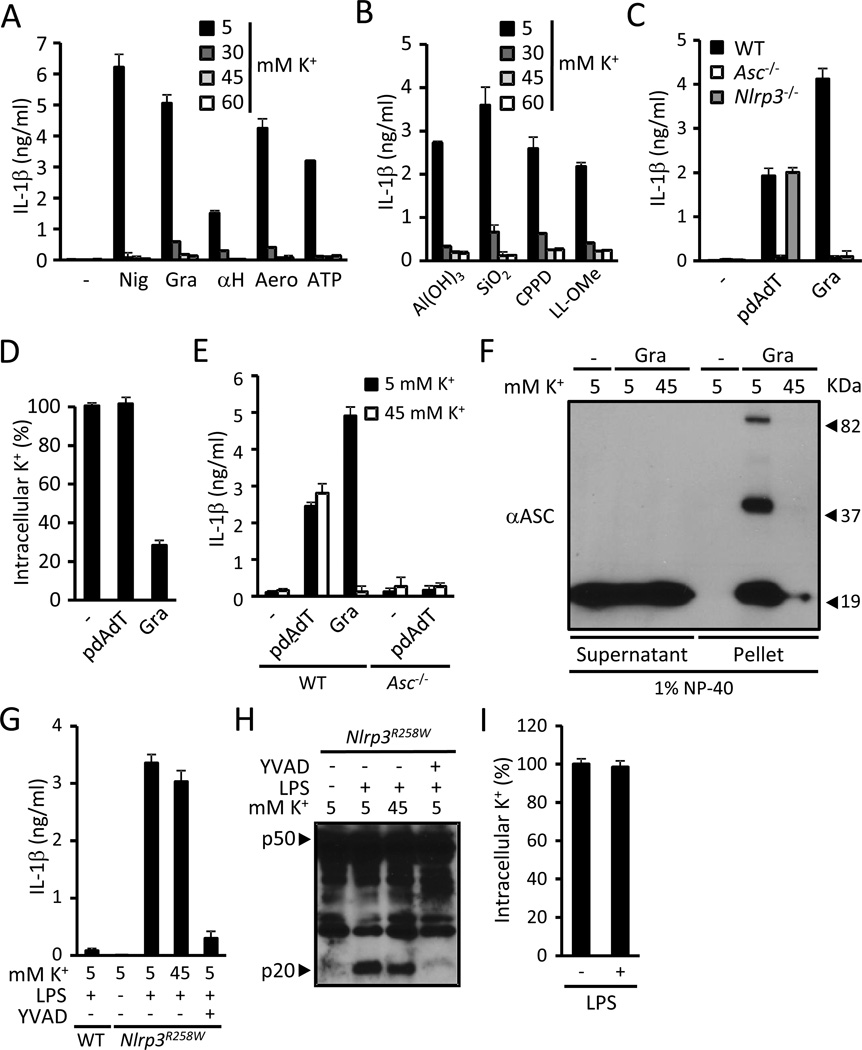
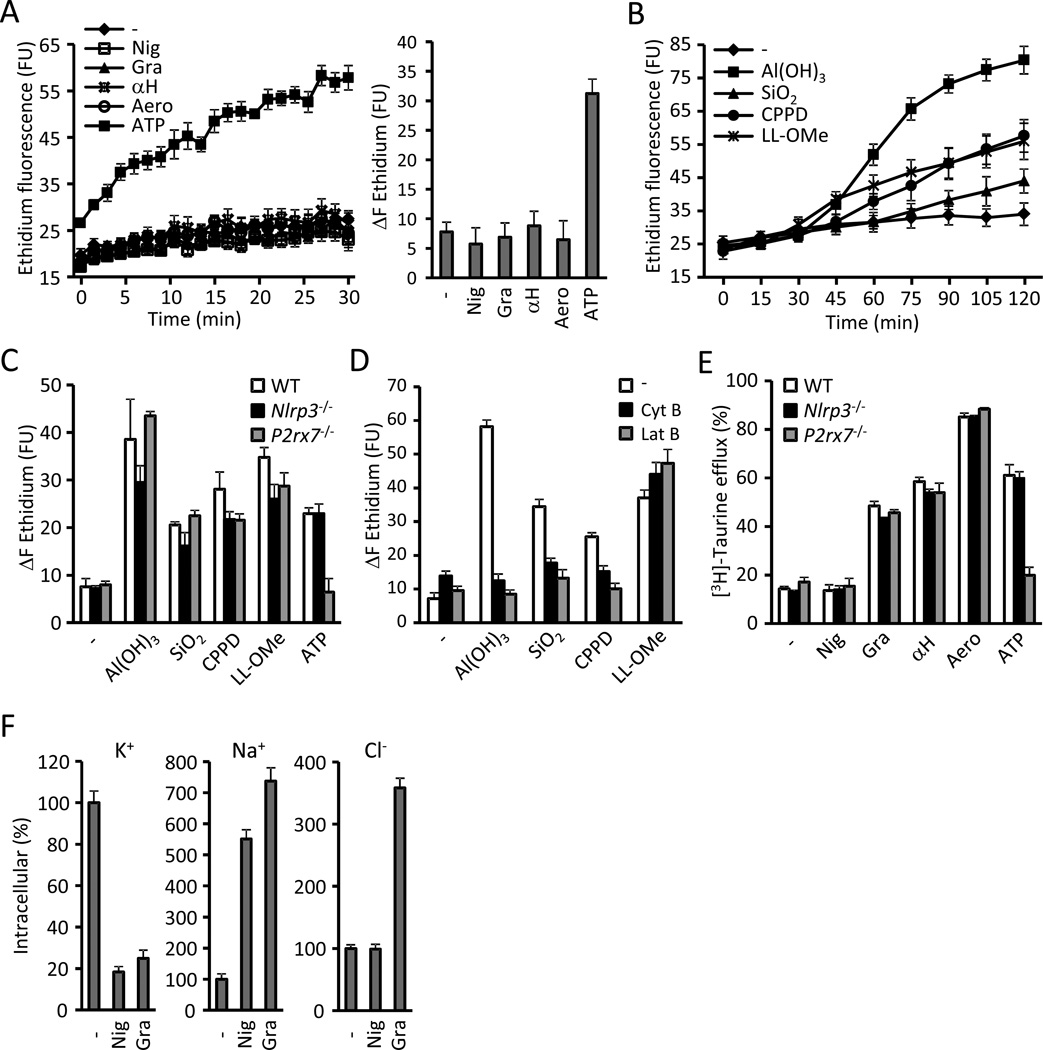
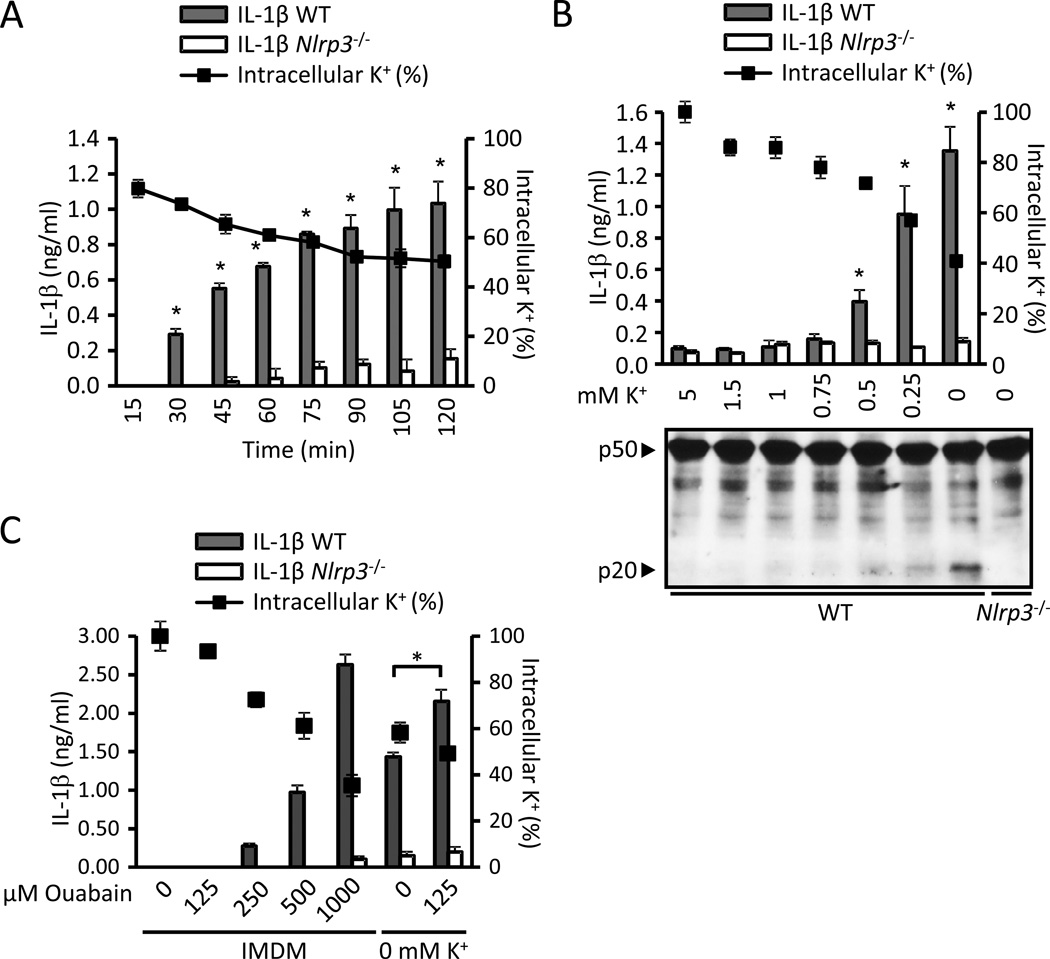
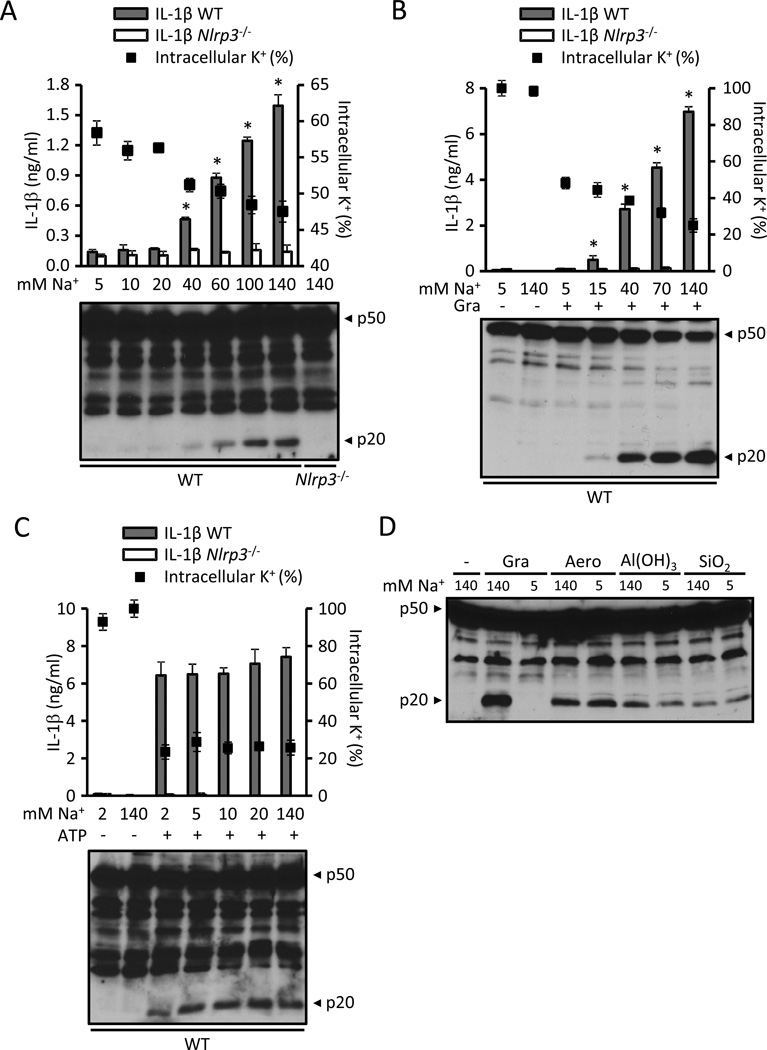
The NLRP3 inflammasome is an important component of the innate immune system. However, its mechanism of activation remains largely unknown. We show that NLRP3 activators including bacterial pore-forming toxins, nigericin, ATP, and particulate matter caused mitochondrial perturbation or the opening of a large membrane pore, but this was not required for NLRP3 activation. Furthermore, reactive oxygen species generation or a change in cell volume was not necessary for NLRP3 activation. Instead, the only common activity induced by all NLRP3 agonists was the permeation of the cell membrane to K⁺ and Na⁺. Notably, reduction of the intracellular K⁺ concentration was sufficient to activate NLRP3, whereas an increase in intracellular Na⁺ modulated but was not strictly required for inflammasome activation. These results provide a unifying model for the activation of the NLRP3 inflammasome in which a drop in cytosolic K⁺ is the common step that is necessary and sufficient for caspase-1 activation.


Conflict of interest statement

The authors declare no financial conflict of interest.

Figures

Figure 1
Figure 1. Mitochondrial perturbation is not required to activate NLRP3
(A) LPS-primed WT and Nlrp3−/−BMDMs were stimulated for 30 min with 10µM nigericin (Nig) or 0.5 µM gramicidin (Gra) and supernatants were analyzed for IL-βp by ELISA. (B) Effect of nigericin (10µM, Nig) and gramicidin (0.5 µM, Gra) on mitochondrial function. Oxygen consumption rate (OCR) and extracellular acidification rate (ECAR) were measured in BMDMs. Black arrows indicate the time of addition of the stimuli. (C and D) BMDMs were treated for 30 min with nigericin (10µM, Nig) or gramicidin (0.5 µuM, Gra) and the intracellular levels of ATP (C) and lactate (D) were determined. (E) Role of Na+/K+-ATPase in mitochondrial perturbation by gramicidin. OCR and ECAR triggered by the addition of 0.5 µM gramicidin (Gra) were measured in the absence (upper panels) and presence (lower panels) of 125 µM ouabain (Oua). Black arrows indicate the time of addition of gramicidin. (F) LPS-primed WT and Nlrp3−/−BMDMs were treated for 15 min with 0.5 µM gramicidin or vehicle in the presence or absence of 125 µM ouabain (Oua) and changed to their respective medium without gramicidin for an additional 15 min. IL-1β was measured in supernatants (left panel) and caspase-1 in cell extracts by immunoblotting (right panel). (G) BMDMs were stimulated for 15 min or 60 min with 0.5 µM gramicidin or left untreated in the presence of 125 µM ouabain (Oua) and the mitochondrial function was evaluated immediately after by performing a bioenergetic profile. Vertical lines indicate the injection of the specified mitochondrial inhibitors. Values represent mean ± standard deviation (n=3–4). Results are representative of at least three separate experiments. NS, not statistically significant (p ≥ 0.05). *, p < 0.05. See also Figure S1.
Figure 2
Figure 2. ROS production is not required to activate NLRP3
(A) LPS-primed WT and Nlrp3−/− BMDMs were stimulated for 6 hrs with 10 µM rotenone, 10 µg/ml antimycin A, 10 mM 3-methyladenine (3-MA) or 1 mM H2O2, or treated 30 min with 0.5 µM of gramidicin. NLRP3 activation was detected by measuring the secretion of IL-1β (upper panel) and caspase-1 activation (lower panel). (B) CM-H2DCFDA -labeled BMDMs were incubated in medium containing ROS scavengers N-acetyl-L-cysteine (NAC, 2.5 mM), N-(2-Mercaptopropionyl)glycine (MPG, 2.5 mM), ascorbic acid (AA,150 µM). The oxidation of CM-H2DCFDA (upper panel) and the oxidation rate (lower panel) were calculated as described in Experimental Procedures. (C) The effect of ROS scavengers on signal 1 and signal 2 of NLRP3 activation induced by gramicidin was evaluated. WT BMDMs were primed with LPS for 3 hrs in the presence of ROS scavengers and subsequently stimulated with 0.5 µM gramicidin (signal 1) or primed for 3 hrs with LPS and stimulated with gramicidin in the presence of ROS scavengers (signal 2). NLRP3 activation was assessed by measuring IL-1β release (upper panel) and caspase-1 activation (lower panel). (D) BMDMs labeled with the fluorescent ROS probe CM-H2DCFDA were stimulated with 0.5 µM gramicidin (Gra), 1 mM H2O2 or medium. The oxidation of CM-H2DCFDA was monitored (upper panel) as in (B) and the oxidation rate was calculated (lower panel). (E) LPS-primed WT BMDMs were stimulated with nigericin (10µM, Nig), gramicidin (0.5 µM, Gra) or 5 mM ATP 30 min with the indicated amount of NAC and caspase-1 activation was analyzed. (F and G) LPS-primed WT (F) and Nlrp3−/− (G) BMDMs were stimulated with nigericin (10µM, Nig), gramicidin (0.5 µM, Gra) or ATP (5 mM) for 30 min, with Salmonella (MOI 10, Sal) for 1 h or with pdAdT (5 µg/ml) for 4 hrs in the presence of the indicated amounts of DPI. Caspase-1 activation (F) and the intracellular content of K+ (G) were measured. Caspase-1 activation was analyzed by immunoblotting and IL-1β by ELISA. Cells were treated 30’ with the inhibitors or medium before adding the agonists. The intracellular levels of K+ were quantified by ICP-OES in Nlrp3−/− cells. Values represent mean ± standard deviation (n=3–4). Results are representative of at least three separate experiments. NS, not statistically significant (p ≥ 0.05). *, p < 0.05 (stimulated vs. unstimulated).
Figure 3
Figure 3. Phagocytosis of particulate matter triggers K+efflux and activates NLRP3
(A,B) LPS-primed WT and Nlrp3−/− BMDMs were treated 30 min with 10 µM nigericin (Nig), 0.5 µM gramicidin (Gra), 10 µg/ml S. aureus α-hemolysin (αH), 10 ng/ml A. hydrophila aerolysin (Aero) or 5 mM ATP. Secreted IL-1β (A) and the intracellular content of K+ (B) were measured. (C) LPS-primed WT and Nlrp3−/− BMDMs were stimulated with 250 µg/ml of Al(OH)3, silica (SiO2) or calcium pyrophosphate crystals (CPPD) or with 1 mM L-leucyl-L-leucine methyl ester (LL-OMe) and secreted IL-1β and the intracellular content of K+ were determined at the specified time points. (D–F) Effect of inhibition of phagocytosis in K+ efflux and NLRP3 activation caused by particulate matter and LL-OMe. LPS-primed WT and Nlrp3−/− BMDMs were incubated 30 min with phagocytosis inhibitors cytochalasin B (Cyt B, 5 µM) or latrunculin B (Lat B, 200 nM) and subsequently treated with 250 µg/ml of Al(OH)3, silica (SiO2) or CPPD, or with 1 mM LL-OMe. The intracellular content of K+ (D) and IL-1β release in WT and Nlrp3−/−BMDMs (E) were measured. K+ determinations were performed by ICP-OES in Nlrp3−/− cells. Values represent mean ± standard deviation (n=3). Results are representative of at least three separate experiments. Asterisks (*) indicate NLRP3 activation (p < 0.05, WT vs. Nlrp3−/−). Crosses (×) indicate a drop in intracellular content of K+ (p < 0.05, stimulated vs. non-stimulated). See also Figure S2.
Figure 4
Figure 4. Cytosolic K+is a specific upstream regulator of the NLRP3 inflammasome
(A) LPS-primed WT BMDMs were stimulated for 30 min with 10 µM nigericin (Nig), 0.5 µM gramicidin (Gra), 10 µg/ml S. aureus α-hemolysin (αH), 10 ng/ml A. hydrophila aerolysin (Aero) or 5 mM ATP in medium containing the specified [K+] and secreted IL-1β was measured. (B) LPS-primed WT BMDMs were stimulated for 2 hrs with 250 µg/ml of Al(OH)3, silica (SiO2) or calcium pyrophosphate crystals (CPPD) or with 1 mM L-leucyl-L-leucine methyl ester (LL-OMe) in medium containing the specified [K+] and secreted IL-1β was measured. (C and D) LPS-primed WT, Asc/− and Nlrp3−/− BMDMs were stimulated with 5 µg/ml pdAdT for 4 hrs or 0.5 µM gramicidin (Gra) for 30 min and the release of IL-1β (C) and the intracellular content of K+ (D) were measured. K+ determinations were performed in Asc−/− macrophages. (E) LPS-primed WT and Asc−/− BMDMs were treated with 5 µg/ml pdAdT for 4 hrs or 0.5 µM gramicidin (Gra) for 30 min in medium containing 5 or 45 mM K+ and IL-1β was quantified in the supernatants. (F) LPS-primed WT BMDMs were stimulated 30 min with 0.5 µM gramicidin (Gra) in medium containing 5 or 45 mM K+. The cells were lysed with 1 % NP-40 and separated by centrifugation in supernatants and pellets. Proteins in cell pellets and supernatants were cross-linked with DSS and immunoblotted with anti-Asc antibody. (G–H) BMDM from WT and Nlrp3R258W mice were stimulated as indicated for 4 hrs (0.5 µg/ml LPS, 100 µM YVAD) and released IL-1β (G) and caspase-1 activation (H) were analyzed. (I) BMDMs from Nlrp3R258W mice were treated with 0.5 µg/ml LPS or vehicle for 4 hrs and the intracellular content of K+ was determined. IL-1β was measured by ELISA, caspase-1 activation by immunoblotting and intracellular K+ by ICP-OES. In experiments with high K+ medium, the osmolarity was maintained at 300 mOsm by isosmotic substitution of NaCl with KCl. Values represent mean ± standard deviation (n=3). Results are representative of at least three separate experiments.
Figure 5
Figure 5. NLRP3 activation correlates with K+ efflux and Na+ influx but not with the opening of a nonselective pore
(A) Ethidium uptake kinetics in BMDMs treated with 10 µM nigericin (Nig), 0.5 µM gramicidin (Gra), 10 µg/ml S. aureus α-hemolysin (αH), 10 ng/ml A. hydrophila aerolysin (Aero) or 5 mM ATP. The total increase of ethidium fluorescence during the stimulation (ΔF ethidium) is shown in the right panel. (B) Ethidium uptake kinetics in BMDMs treated with 250 µg/ml of Al(OH)3, silica (SiO2) or calcium pyrophosphate crystals (CPPD) or with 1 mM L-leucyl-L-leucine methyl ester (LL-OMe) for 2 hrs. (C) WT, Nlrp3−/− and P2rx7−/− BMDMs were stimulated for 2 hrs with 250 µg/ml of Al(OH)3, silica (SiO2), CPPD crystals and 1 mM LL-OMe and the ethidium uptake was quantitated. ATP (5 mM, 30 min) was used as a control for P2rx7 signaling. (D) Ethidium uptake by BMDMs stimulated for 2 hrs with 250 µg/ml Al(OH)3, silica (SiO2), CPPD crystals and 1 mM LL-OMe in the presence of phagocytosis inhibitors cytochalasin B (5 µM, Cyt B) and latrunculin B (200 nM, Lat B). (E) [3H]-taurine efflux was determined in WT, Nlrp3−/− and P2rx7−/− BMDMs treated 30 min with 10 µM nigericin (Nig), 0.5 µM gramicidin (Gra), 10 µg/ml S. aureus α-hemolysin (αH), 10 ng/ml A. hydrophila aerolysin (Aero) or 5 mM ATP. (F) The intracellular content of K+, Na+ and Cl was determined in BMDMs treated 30 min with 10 µM nigericin (Nig) or 0.5 µM gramicidin (Gra). Na+ and K+ were measured by ICP-OES and Cl by ICP-MS in Nlrp3−/− cells. Values represent mean ± standard deviation (n=3). Results are representative of at least three separate experiments. FU, fluorescence units. See also Figure S3.
Figure 6
Figure 6. Incubation in low-K+ medium is sufficient to activate NLRP3
(A) LPS-primed WT and Nlrp3−/− BMDMs were incubated in K+-free medium and the release of IL-1β (bars) and intracellular content of K+ (solid squares) were measured at the specified time points. (B) LPS-primed WT and Nlrp3−/− BMDMs were incubated for 2 hrs in medium containing the specified [K+] and the release of IL-1β (bars) and intracellular content of K+ (solid squares) were measured. (C) LPS-primed WT and Nlrp3−/− BMDMs were treated with ouabain for 2 hours in IMDM or K+-free medium and the release of IL-1β and the intracellular content of K+ were determined. IL-1β secretion was analyzed by ELISA. K+ determinations were performed in Nlrp3−/− cells. Values represent mean ± standard deviation (n=3). *, statistically significant (p < 0.05, WT vs. Nlrp3−/−). Results are representative of at least three separate experiments. See also Figure S4.
Figure 7
Figure 7. Na+ influx can modulate NLRP3 but is not a strict requirement for inflammasome activation
(A) LPS-primed WT and Nlrp3−/− BMDMs were incubated for 3 hrs in K+-free medium containing the specified [Na+] and the release of IL-1β (bars) and the intracellular content of K+ (solid squares) were measured. (B and C) LPS-primed WT and Nlrp3−/− BMDMs were stimulated for 45 min with 0.5 µM gramicidin (Gra) (B) or 5 mM ATP (C) in media containing 5 mM K+ and the specified [Na+]. The release of IL-1β (bars), the intracellular content of K+ (solid squares) and caspase-1 activation were analyzed. (D) LPS-primed WT BMDMs were stimulated for 45 min with 0.5 µM gramicidin (Gra) or 10 ng/ml aerolysin (Aero) or for 3 hrs with 250 µg/ml Al(OH)3 or silica (SiO2) in medium containing 5 mM K+ and either 140 or 5 mM Na+ and caspase-1 activation was analyzed. In low Na+ medium, NaCl was isosmotically substituted with choline chloride to maintain a final osmolarity of 300 mOsm. IL-1β was measured by ELISA and caspase-1 activation by immunoblotting. K+ determinations were performed in Nlrp3−/− cells. Values represent mean ± standard deviation (n=3). Results are representative of at least three separate experiments. *, statistically significant (p < 0.05, WT vs. Nlrp3−/−). See also Figure S5.

Comment in

References

    1. Allam R, Darisipudi MN, Rupanagudi KV, Lichtnekert J, Tschopp J, Anders HJ. Cutting edge: cyclic polypeptide and aminoglycoside antibiotics trigger IL-1beta secretion by activating the NLRP3 inflammasome. J Immunol. 2011;186:2714–2718. - PubMed
    1. Andersen OS, Koeppe RE, Roux B. Gramicidin channels. IEEE Transactions on Nanobioscience. 2005;4:10–20. - PubMed
    1. Bauernfeind F, Bartok E, Rieger A, Franchi L, Nunez G, Hornung V. Cutting edge: reactive oxygen species inhibitors block priming, but not activation, of the NLRP3 inflammasome. J Immunol. 2011;187:613–617. - PMC - PubMed
    1. Bauernfeind FG, Horvath G, Stutz A, Alnemri ES, MacDonald K, Speert D, Fernandes-Alnemri T, Wu J, Monks BG, Fitzgerald KA, et al. Cutting edge: NF-kappaB activating pattern recognition and cytokine receptors license NLRP3 inflammasome activation by regulating NLRP3 expression. J Immunol. 2009;183:787–791. - PMC - PubMed
    1. Blaustein MP, Goldring JM. Membrane potentials in pinched-off presynaptic nerve ternimals monitored with a fluorescent probe: evidence that synaptosomes have potassium diffusion potentials. The Journal of Physiology. 1975;247:589–615. - PMC - PubMed

Publication types

MeSH terms