. 2013 Jun 27;38(6):1198-210.
doi: 10.1016/j.immuni.2013.06.005.

Specific gut commensal flora locally alters T cell tuning to endogenous ligands

Affiliations

Specific gut commensal flora locally alters T cell tuning to endogenous ligands

Pascal Chappert et al. Immunity. .

Abstract

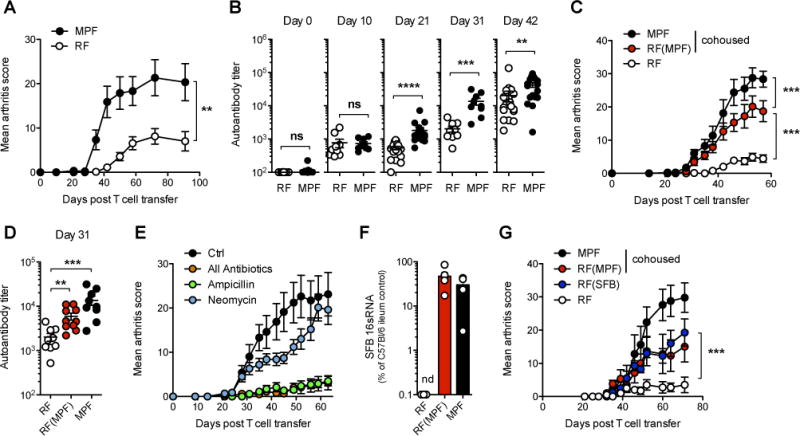
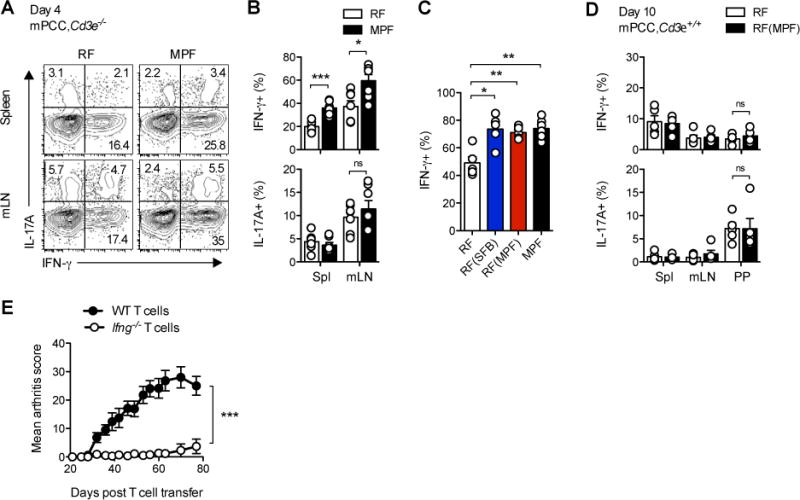
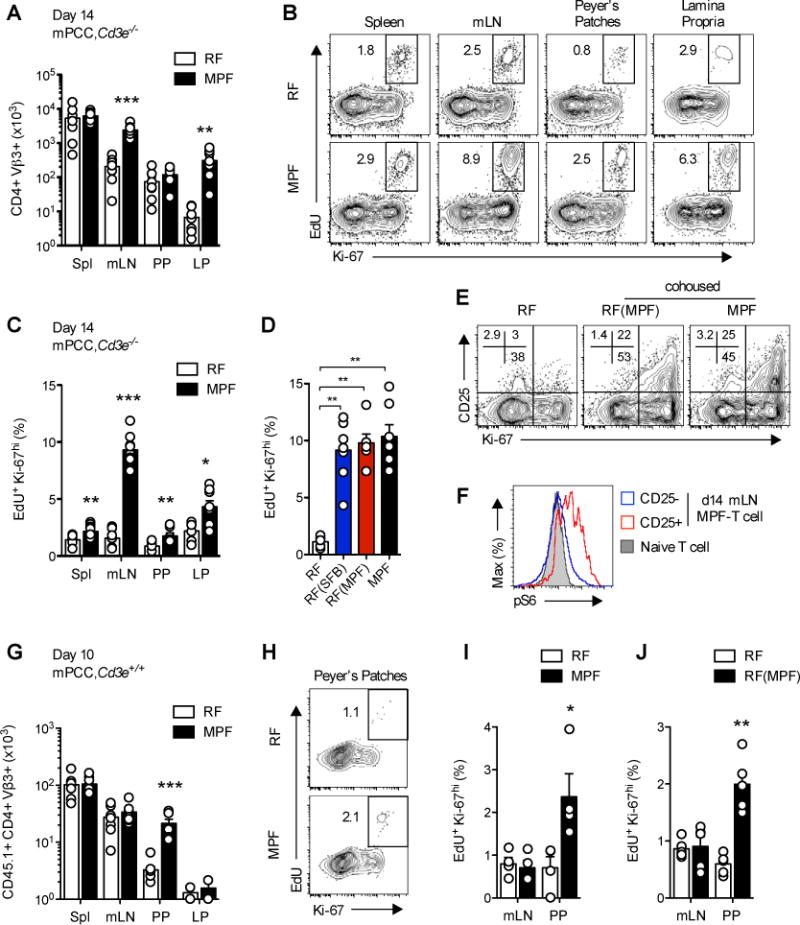
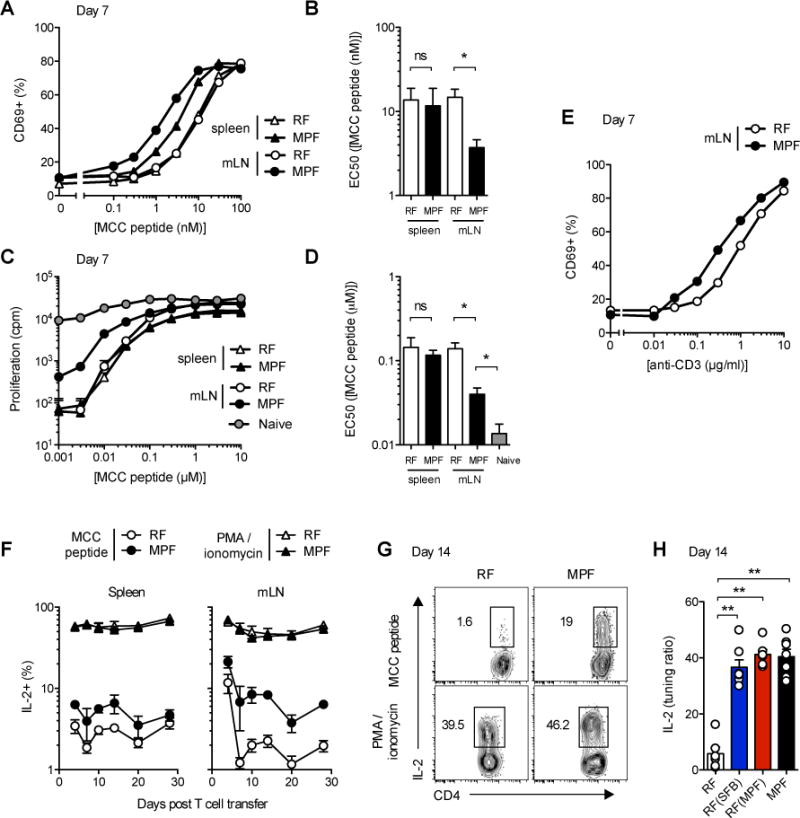
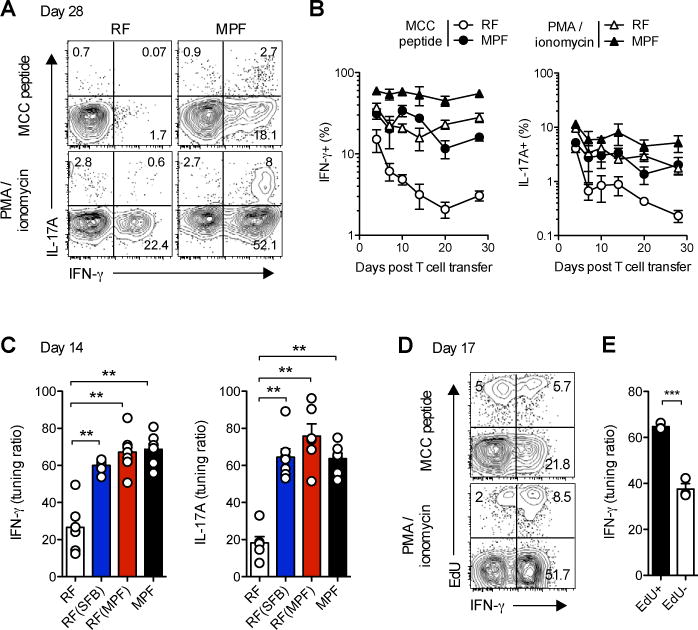
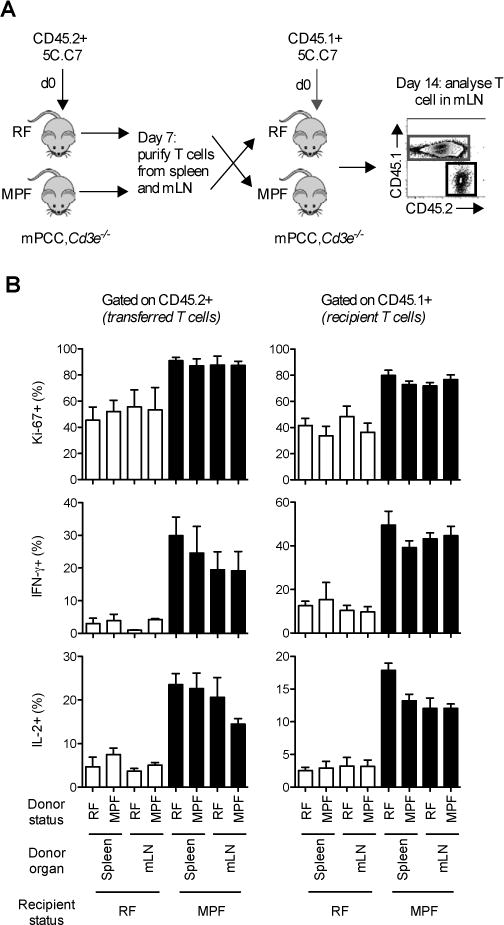
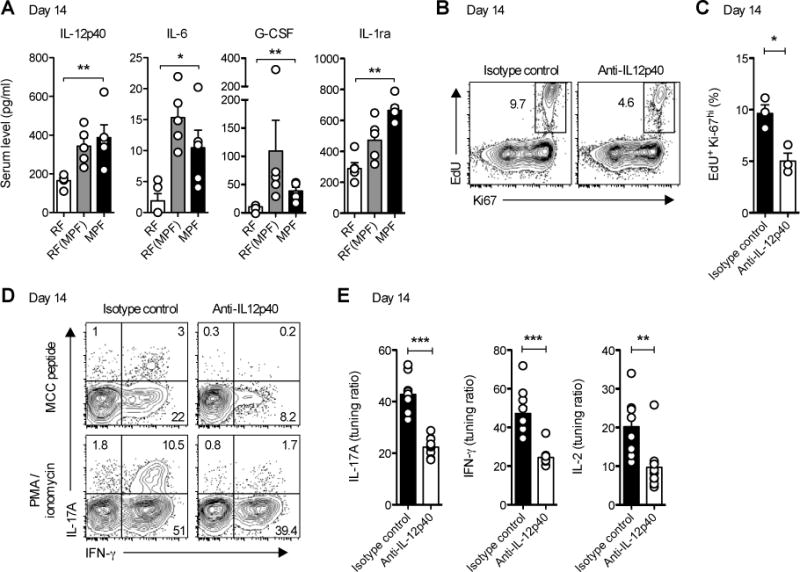
Differences in gut commensal flora can dramatically influence autoimmune responses, but the mechanisms behind this are still unclear. We report, in a Th1-cell-driven murine model of autoimmune arthritis, that specific gut commensals, such as segmented filamentous bacteria, have the ability to modulate the activation threshold of self-reactive T cells. In the local microenvironment of gut-associated lymphoid tissues, inflammatory cytokines elicited by the commensal flora dynamically enhanced the antigen responsiveness of T cells that were otherwise tuned down to a systemic self-antigen. Together with subtle differences in early lineage differentiation, this ultimately led to an enhanced recruitment of pathogenic Th1 cells and the development of a more severe form of autoimmune arthritis. These findings define a key role for the gut commensal flora in sustaining ongoing autoimmune responses through the local fine tuning of T-cell-receptor-proximal activation events in autoreactive T cells.


Figures

Figure 1
Figure 1. SFB colonization of host gut-commensal flora enhances the severity of autoimmune disease in a T cell transfer model of arthritis
(A) Weekly arthritis score and (B) serum autoantibody titers in RF- or MPF-housed mPCC, Cd3e−/− hosts at indicated time points after naïve 5C.C7 T cell transfer. Data (mean±SEM) pooled from two (A) and four (B) independent experiments (n=9 and 18 mice per group respectively). (C–D) One group of RF-housed mPCC, Cd3e−/− mice was cohoused with MPF-housed hosts for 3 weeks prior to T cell transfer (RF(MPF)). (C) Bi-weekly arthritis scores and (D) autoantibody titers at day 31. Data (mean±SEM) pooled from two independent experiments (n=9 RF, n=10 RF(MPF) and n=8 MPF). (E) Various antibiotic formulations were given in the drinking water of MPF-housed mPCC, Cd3e−/− mice starting 3 weeks prior to T cell transfer and maintained for the length of the experiment. “All antibiotics” formulation contains ampicillin, neomycin, vancomycin and metronidazole. Data (mean±SEM) pooled from two independent experiments (n=10 mice per group). (F) Amount of SFB 16sRNA in cecum contents of indicated mPCC, Cd3e−/− hosts 8 weeks post T cell transfer (n=5 mice per group, mean±SEM). (G) Same as (C) with an additional group of RF-housed mPCC, Cd3e−/− mice cohoused with SFB-monocolonized GF mice 3 weeks prior to T cell transfer (RF(SFB)). (n=4 RF and RF(SFB), n=6 RF(MPF) and n=5 MPF, mean±SEM). See also Figure S1.
Figure 2
Figure 2. SFB-containing flora promotes the differentiation of arthritis-inducing Th1 cells
(A–C) 4 days post transfer of naïve 5C.C7 T cells into mPCC, Cd3e−/− hosts, the cells were stained for intracellular IL-17A and IFN-γ following a 3h stimulation with PMA and ionomycin. (A) Representative IFN-γ and IL-17A expression profiles, gated on live, CD4+Vβ3+ T cells and (B) frequencies of IFN-γ+ or IL17A+ CD4+Vβ3+ T cells in the indicated organs. (C) Frequencies of IFN-γ+ in CD4+Vβ3+ T cells in mLN of indicated host. Data (mean±SEM) pooled from 3 independent experiments each (n=7 (A–B) and n=5–6 (C) mice per group). (D) 10 days post transfer of naïve CD45.1+ 5C.C7 T cells into 8–12 wk. old mPCC, Cd3e+/+ hosts, the cells were stained for intracellular IL-17A and IFN-γ following a 5.5h stimulation with PMA and ionomycin. Frequencies of IFN-γ+ or IL17A+ in CD45.1+ CD4+Vβ3+ T cells in indicated organs. Data (mean±SEM) pooled from 5 independent experiments, each representing one pool of 6 RF-housed or 2 cohoused-RF(MPF) mice. RF(MPF) hosts were cohoused for 2 weeks with MPF-housed mPCC, Cd3e−/− mice prior to T cell transfer. (E) Bi-weekly arthritis scores of MPF-housed mPCC, Cd3e−/− mice post transfer of naïve 5C.C7 WT or Ifng−/− 5C.C7, Rag2−/− T cells. Data (mean±SEM) pooled from two independent experiments (n=10 mice per group). See also Figure S2.
Figure 3
Figure 3. SFB-containing flora sustains chronic proliferation of self-reactive CD4+ T cells
(A–D) 14 days post naïve 5C.C7 T cell transfer, mPCC, Cd3e−/− hosts were injected with EdU and sacrificed 1hr. later. (A) Absolute number of CD4+Vβ3+ T cells in spleen, mLN, Peyer’s patches (PP) and lamina propria (LP) of the small intestine. (B) Representative EdU and Ki-67 expression profiles and (C–D) Frequency of EdU+Ki-67hi cells in live, CD4+Vβ3+ T cells isolated from indicated organs of RF- or MPF-housed hosts (B–C) or mLN of indicated hosts (D). Data (mean±SEM) pooled from 3 independent experiments each ((A–C) n=8 and (D) n=6–7 mice per group). (E) Representative CD25 and Ki-67 expression profiles, gated on CD4+Vβ3+ T cells and (F) representative phosphorylated S6 ribosomal protein (pS6) expression profile in CD25− (open, blue line) and CD25+ (open, red line) CD4+Vβ3+ T cells isolated from mLN of indicated hosts at day 14 and compared to naive 5C.C7 T cells (closed, grey). (G–I) 10 days post transfer of naïve CD45.1+ 5C.C7 T cells into 4–5 wk. old mPCC, Cd3e+/+ hosts, the recipient mice were injected with EdU and sacrificed 1 hr. later. (G) Absolute number of CD45.1+CD4+Vβ3+ T cells recovered at day 10 from indicated organs. (H) Representative EdU and Ki-67 expression profiles and (I) frequency of EdU+Ki-67hi cells in live, CD45.1+CD4+Vβ3+ T cells isolated from mLN and PP. Data (mean±SEM) pooled from 6 (G) and 4 (H–I) independent experiments. (n=6 pools of 1 to 3 mice per group and 4 pools of 3 mice per group respectively). (J) Same as (I) in 8–12 wk. old RF-housed mPCC, Cd3e+/+ mice cohoused for 2 weeks with MPF-housed mPCC, Cd3e−/− mice prior to T cell transfer. Data (mean±SEM) pooled from 5 independent experiments, each representing one pool of 6 RF-housed or 2 cohoused-RF(MPF) mice. (G–J) All EdU and Ki-67 stainings were performed on purified CD4+ T cells. See also Figure S3.
Figure 4
Figure 4. SFB-containing flora locally modulates T cell intrinsic tuning of TCR activation threshold to endogenous antigen
(A and E) CD69 expression and (C) 3H-Thymidine incorporation in CD4+Vβ3+ T cells purified from spleen or mLN of mPCC, Cd3e−/− hosts 7 days post naïve 5C.C7 T cell transfer and cultured for 16h (A and E) or 84h (B) with fresh Cd3e−/− splenocytes and various concentrations of MCC peptide (A and C) or plate-bound anti-CD3 (2C11) and soluble anti-CD28 in the absence of added APC (E). 3H-Thymidine was added to the culture for the last 24h. One representative experiment out of 4 (pooled triplicates) or 3, respectively. (B and D) Summary of EC50 for each independent T cell population tested. Data (mean±SEM) pooled from (A–B) 5 and (C–D) 3 independent experiments, * P<0.05, student t test. (F) Frequencies of IL-2+ cells in live, CD4+Vβ3+ T cells isolated from spleen or mLN of mPCC, Cd3e−/− hosts at the indicated time points post T cell transfer and restimulated for 3h with PMA and ionomycin or 3μM MCC peptide. (G) Representative expression profiles and (H) tuning ratios, as described in experimental procedures, for IL-2 in live, CD4+Vβ3+ T cells isolated at day 14 in mLN of indicated host. Data (mean±SEM) pooled from 5 independent experiments (n=2 to 7 mice per time point) (F) and 3 independent experiments (n=6–7 mice per group) (H). See also Figure S4.
Figure 5
Figure 5. Modulation of T cell tuning by commensal flora broadly affects self-reactive CD4+ Th1 and Th17 subsets
(A) Representative expression profiles at day 28 and (B) Frequencies of IFN-γ+ and IL17A+cells in live, CD4+Vβ3+ T cells isolated from mLN of mPCC, Cd3e−/− hosts at the indicated time points post naïve 5C.C7 T cell transfer and restimulated for 3h with PMA and ionomycin or 3μM MCC peptide. (C) Tuning ratios, as described in experimental procedures, for IFN-γ and IL17A in live, CD4+Vβ3+ T cells isolated from mLN of indicated hosts 14 days post T cell transfer and restimulated for 3h with PMA and ionomycin or 3μM MCC peptide. Data (mean±SEM) pooled from 3 independent experiments (n=6–7 mice per group). (D–E) 17 or 26 days post T cell transfer, MPF-housed mPCC, Cd3e−/− hosts were injected with EdU and sacrificed 1hr later. (D) Representative EdU and IFN-γ expression profiles in live, CD4+Vβ3+ T cells isolated from mLN at day 17. (E) Tuning ratio for IFN-γ in live, EdU+ versus EdU CD4+Vβ3+ T cells. Data (mean±SEM) pooled from 2 independent experiments (n=3 mice per group).
Figure 6
Figure 6. Host microbiota dynamically regulates self-reactive T cell tuning
(A) Two cohorts of mPCC, Cd3e−/− mice were injected simultaneously with either naïve CD45.2+ 5C.C7 T cells or CD45.1+ 5C.C7 T cells. 7 days later, spleen and mLN were harvested from hosts injected with CD45.2+ T cells. Purified T cells (106) were further reinjected into the hosts previously transferred with CD45.1+ T cells. mLN cells were stained at day 14 for Ki-67 expression or for intracellular IL-2 and IFN-γ following 3h stimulation with 3μM MCC peptide (MCC). (B) Frequency of Ki-67+ (top), IFN-γ+ (middle), or IL-2+ (bottom) in live, CD4+Vβ3+ T cells in the CD45.2+ donor (left) or the CD45.1+ recipient (right) fractions. Data (mean±SEM) pooled from 3 independent experiments. See also Figure S5.
Figure 7
Figure 7. In vivo IL-12p40 blockade restores optimal T cell tuning in MPF-housed hosts
(A) IL-12p40, IL-6, G-CSF and IL-1Ra levels in sera of mPCC, Cd3e−/− hosts 14 days post naïve 5C.C7 T cell transfer. Data (mean±SEM) pooled from 2 independent experiments (n=5 mice per group). (B–E) Starting at day 7, MPF-housed mPCC, Cd3e−/− mice were further injected twice daily i.p. with anti-IL12p40 or a corresponding isotype control mAb. At day 14, mice were injected with EdU and sacrificed 1hr later. (B) Representative EdU and Ki67 expression profiles and (C) frequency of EdU+Ki-67hi cells in live, CD4+Vβ3+ T cells isolated from mLN (n=3 mice per group, mean±SEM). * P<0.05, student t test. (D) Representative IL-17A and IFN-γ expression profiles and (E) tuning ratio for IL-17A (left), IFN-γ (middle) and IL-2 (right) production in live, CD4+Vβ3+ T cells isolated from mLN at day 14 and restimulated for 3h with PMA and ionomycin or 3μM MCC peptide. Data (mean±SEM) pooled from 4 independent experiments (n=9–10 mice per group). See also Figure S6.

References

    1. Abt MC, Osborne LC, Monticelli LA, Doering TA, Alenghat T, Sonnenberg GF, Paley MA, Antenus M, Williams KL, Erikson J, et al. Commensal bacteria calibrate the activation threshold of innate antiviral immunity. Immunity. 2012;37:158–170. - PMC - PubMed
    1. Ahern PP, Schiering C, Buonocore S, McGeachy MJ, Cua DJ, Maloy KJ, Powrie F. Interleukin-23 drives intestinal inflammation through direct activity on T cells. Immunity. 2010;33:279–288. - PMC - PubMed
    1. Allen A, Zheng Y, Gardner L, Safford M, Horton MR, Powell JD. The novel cyclophilin binding compound, sanglifehrin A, disassociates G1 cell cycle arrest from tolerance induction. J Immunol. 2004;172:4797–4803. - PubMed
    1. Anderson CF, Oukka M, Kuchroo VJ, Sacks D. CD4(+)CD25(−)Foxp3(−) Th1 cells are the source of IL-10-mediated immune suppression in chronic cutaneous leishmaniasis. J Exp Med. 2007;204:285–297. - PMC - PubMed
    1. Atarashi K, Tanoue T, Shima T, Imaoka A, Kuwahara T, Momose Y, Cheng G, Yamasaki S, Saito T, Ohba Y, et al. Induction of colonic regulatory T cells by indigenous Clostridium species. Science. 2011;331:337–341. - PMC - PubMed

Publication types

MeSH terms