. 2013 Aug;16(8):964-74.
doi: 10.1111/ele.12142. Epub 2013 Jul 1.

Diversification under sexual selection: the relative roles of mate preference strength and the degree of divergence in mate preferences

Affiliations
Free PMC article

Diversification under sexual selection: the relative roles of mate preference strength and the degree of divergence in mate preferences

Rafael L Rodríguez et al. Ecol Lett. 2013 Aug.
Free PMC article

Abstract

The contribution of sexual selection to diversification remains poorly understood after decades of research. This may be in part because studies have focused predominantly on the strength of sexual selection, which offers an incomplete view of selection regimes. By contrast, students of natural selection focus on environmental differences that help compare selection regimes across populations. To ask how this disparity in focus may affect the conclusions of evolutionary research, we relate the amount of diversification in mating displays to quantitative descriptions of the strength and the amount of divergence in mate preferences across a diverse set of case studies of mate choice. We find that display diversification is better explained by preference divergence rather than preference strength; the effect of the latter is more subtle, and is best revealed as an interaction with the former. Our findings cast the action of sexual selection (and selection in general) in a novel light: the strength of selection influences the rate of evolution, and how divergent selection is determines how much diversification can occur. Adopting this view will enhance tests of the relative role of natural and sexual selection in processes such as speciation.

Keywords: Diversification; mate preference function; sexual coevolution.


Figures

Figure 1
Figure 1
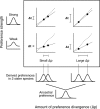
Heuristic model for the relationship between the amount of divergence in the display trait values favoured by mate preferences (labelled Δp, depicted on the x-axis), the strength of the mate preferences (depicted on the y-axis) and the resulting divergence in mating displays (labelled Δt, indicated with brackets by each panel). We show this for two sister species, indicated as the two data points in each panel. The amount of preference divergence dictates how much display divergence can occur: more divergent preferences (greater Δp) result in more divergent displays (greater Δt). Preference strength, by contrast, determines the rate of evolution (faster with stronger preferences) and the closeness of the display–preference match (closer with strong preferences). In each panel, the dotted line indicates a perfect 1 : 1 match between displays and preferences. Bottom: an ancestral and two derived preference functions, one for each sister species.
Figure 2
Figure 2
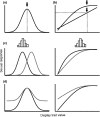
Preference functions relate variation in sexual response to variation in display traits. (a) Closed preference functions rise to peak response at the preferred display trait value (‘peak preference’; arrow) and then decline. (b) Open preference functions continue to rise or level off, although a peak may be defined (arrows) if further display investment brings diminishing returns. (c) In relation to display trait distributions (histograms), preference functions make predictions about the form of selection (see text). Here, black vs. grey functions predict stabilising vs. directional selection (closed preferences) or varying directional selection (open preferences). Note that a closed preference may predict stabilising or directional selection according to the position of the display trait distribution relative to peak preference. (d) Preference functions may vary in strength (grey is weaker), according to the extent of the decrease in attractiveness as displays deviate from peak preference.
Figure 3
Figure 3
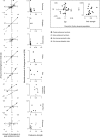
Examples of variation in display–preference correspondence. (a) Close correspondence with strong preferences for Enchenopa signal frequency. (b) Lax correspondence with weaker preferences for Enchenopa signal length. (c) The pattern from panel a, plotting mean signal and peak preference values. Here and below, the 1 : 1 line indicates perfect correspondence. (d) The pattern from panel b, plotting mean signal and peak preference values. (e) Correspondence among eight Hyla cinerea populations, apparent over a pattern of reproductive character displacement; dark green: rough sympatry with closely related H. gratiosa; light green: rough allopatry. (f) No correspondence in the panmictic cricket population. (g) Correspondence among species and traits in Enchenopa. (h) Correspondence among species and traits across our case studies. In (g) and (h) the axes are dimensionless; shifts along these axes denote changes in trait type, not trait units. (a)–(d) redrawn with permission from Rodríguez et al. (2006).
Figure 4
Figure 4
Relationship between the amount of divergence in display traits (Δt) and the amount of divergence in peak preferences (Δp, left column), or preference strength (right column) for our case studies. The relationship between Δt and Δp was consistently positive and strong, except for the panmictic cricket population (inset). By contrast, there was no relationship between Δt and preference strength. Note the much lower magnitude of Δt and Δp values for the panmictic cricket population (inset).
Figure 5
Figure 5
Effect sizes (r) for the relationship between the amount of divergence in peak preferences (Δp) or preference strength and the amount of divergence in display traits (Δt). Data points show effect size estimates for each trait in each case study. (a) Effect sizes for Δp were greater than for preference strength. (b) Effect sizes varied with the sample size of each case study (N = # data points in case study = # traits × # taxa in case study), but remained consistently large and positive for Δp, and either small or large negative for preference strength. Fitted lines are quadratic functions that asymptote at a larger effect size for Δp than for preference strength.
Figure 6
Figure 6
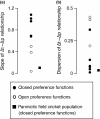
The relationship between the amount of divergence in peak preferences (Δp) and display traits (Δt) was steeper and less disperse for closed preferences than for open preferences. (a) Difference in slope: F1,7 = 19.12, P = 0.0033. (b) Difference in dispersion around trend line, measured with the Standard Error of the Estimate (SEE = √MSerror): F1,7 = 8.81, P = 0.021.

References

    1. Andersson M. Sexual Selection. New Jersey: Princeton; 1994.
    1. Arnegard ME, McIntyre PB, Harmon LJ, Zelditch ML, Crampton WGR, Davis JK, et al. Sexual signal evolution outpaces ecological divergence during electric fish species radiation. Am. Nat. 2010;176:335–356. - PubMed
    1. Arnqvist G. Comparative evidence for the evolution of genitalia by sexual selection. Nature. 1998;393:784–786.
    1. Bailey NW. Love will tear you appart: different components of female choice exert contrasting selection pressures on male field crickets. Behav. Ecol. 2008;19:960–966.
    1. Boughman JW. Divergent sexual selection enhances reproductive isolation in sticklebacks. Nature. 2001;411:944–948. - PubMed

Publication types