

Whole body oxygen uptake and evoked knee torque in response to low frequency electrical stimulation of the quadriceps muscles: V•O2 frequency response to NMES
- PMID: 23809189
- PMCID: PMC3704694
- DOI: 10.1186/1743-0003-10-63
Whole body oxygen uptake and evoked knee torque in response to low frequency electrical stimulation of the quadriceps muscles: V•O2 frequency response to NMES
Abstract
Background: There is emerging evidence that isometric Neuromuscular Electrical Stimulation (NMES) may offer a way to elicit therapeutically significant increases in whole-body oxygen uptake in order to deliver aerobic exercise to patients unable to exercise volitionally, with consequent gains in cardiovascular health. The optimal stimulation frequency to elicit a significant and sustained pulmonary oxygen uptake has not been determined. The aim of this study was to examine the frequency response of the oxygen uptake and evoked torque due to NMES of the quadriceps muscles across a range of low frequencies spanning the twitch to tetanus transition.
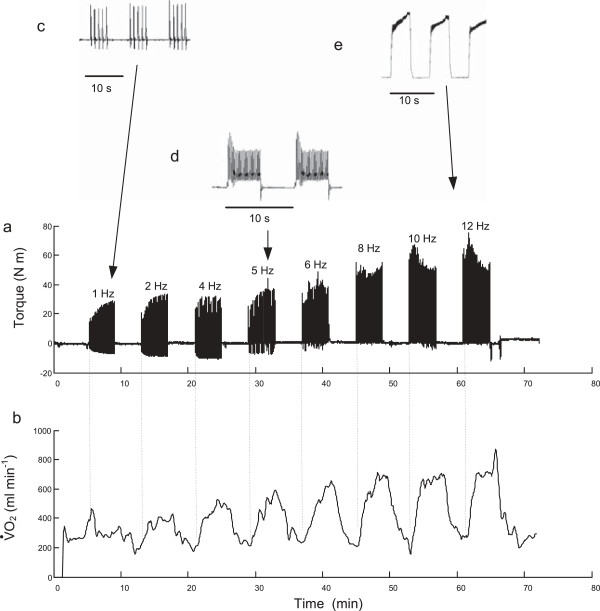
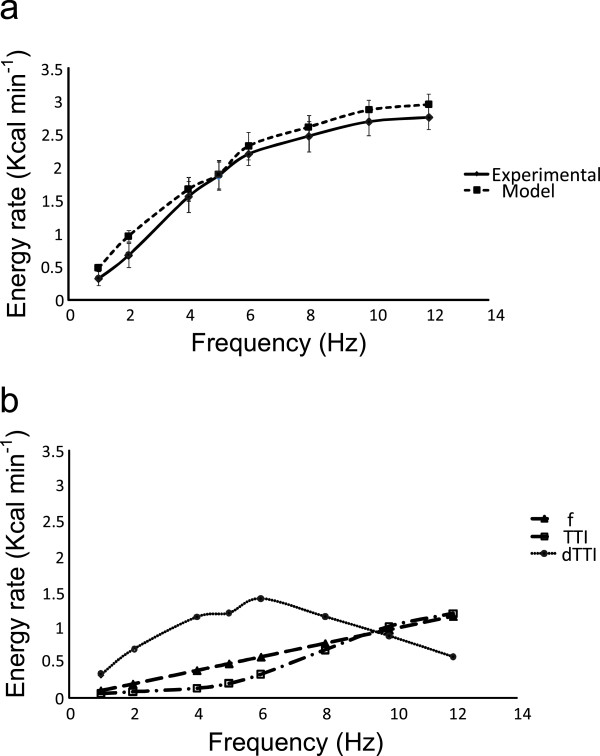
Methods: Ten healthy male subjects underwent bilateral NMES of the quadriceps muscles comprising eight 4 minute bouts of intermittent stimulation at selected frequencies in the range 1 to 12 Hz, interspersed with 4 minutes rest periods. Respiratory gases and knee extensor torque were simultaneously monitored throughout. Multiple linear regression was used to fit the resulting data to an energetic model which expressed the energy rate in terms of the pulse frequency, the torque time integral and a factor representing the accumulated force developed per unit time.
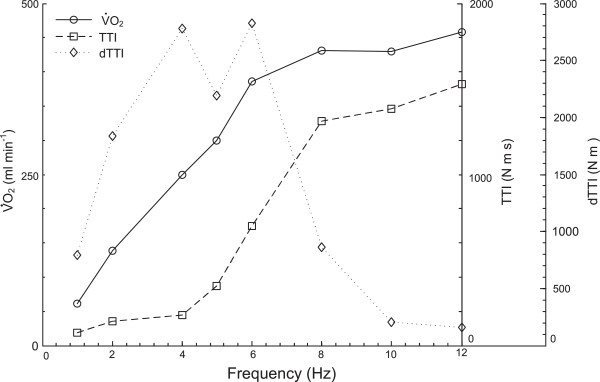
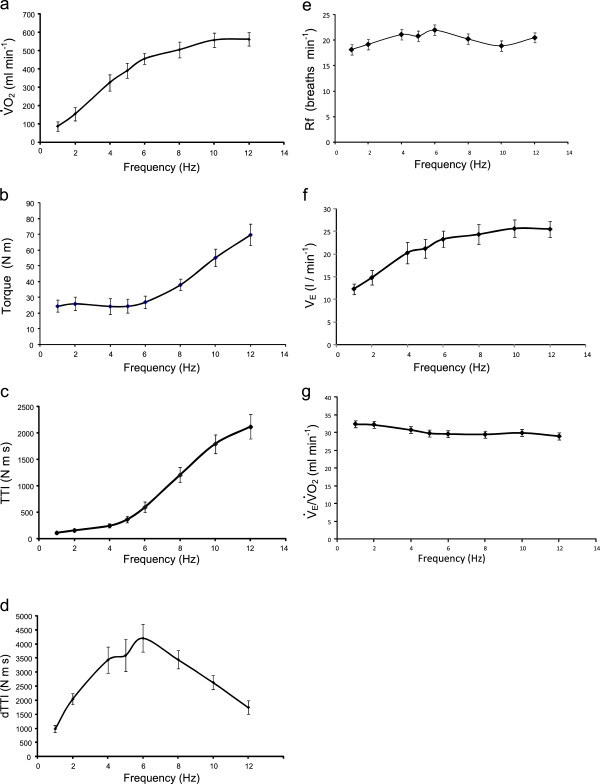
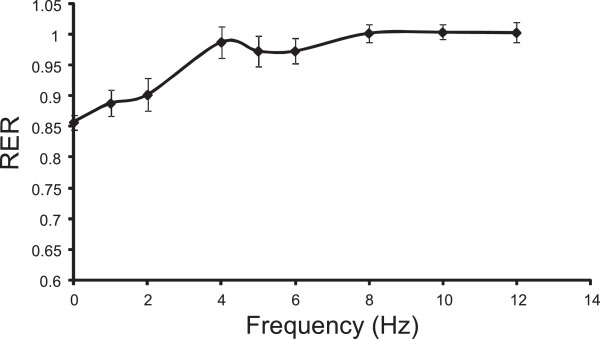
Results: Additional oxygen uptake increased over the frequency range to a maximum of 564 (SD 114) ml min-1 at 12 Hz, and the respiratory exchange ratio was close to unity from 4 to 12 Hz. While the highest induced torque occurred at 12 Hz, the peak of the force development factor occurred at 6 Hz. The regression model accounted for 88% of the variability in the observed energetic response.
Conclusions: Taking into account the requirement to avoid prolonged tetanic contractions and to minimize evoked torque, the results suggest that the ideal frequency for sustainable aerobic exercise is 4 to 5 Hz, which coincided in this study with the frequency above which significant twitch force summation occurred.
Figures
Similar articles
-
Whole body oxygen uptake and evoked torque during subtetanic isometric electrical stimulation of the quadriceps muscles in a single 30-minute session.Arch Phys Med Rehabil. 2014 Sep;95(9):1750-8. doi: 10.1016/j.apmr.2014.04.004. Epub 2014 Apr 24. Arch Phys Med Rehabil. 2014. PMID: 24769070 Clinical Trial.
-
Motor unit recruitment when neuromuscular electrical stimulation is applied over a nerve trunk compared with a muscle belly: quadriceps femoris.J Appl Physiol (1985). 2012 Jul;113(1):78-89. doi: 10.1152/japplphysiol.00074.2011. Epub 2012 May 3. J Appl Physiol (1985). 2012. PMID: 22556395
-
Effect of tendon vibration during wide-pulse neuromuscular electrical stimulation (NMES) on muscle force production in people with spinal cord injury (SCI).BMC Neurol. 2018 Feb 13;18(1):17. doi: 10.1186/s12883-018-1020-9. BMC Neurol. 2018. PMID: 29433467 Free PMC article.
-
Effect of muscle length on maximum evoked torque, discomfort, contraction fatigue, and strength adaptations during electrical stimulation in adult populations: A systematic review.PLoS One. 2024 Jun 10;19(6):e0304205. doi: 10.1371/journal.pone.0304205. eCollection 2024. PLoS One. 2024. PMID: 38857245 Free PMC article.
-
Can the Use of Neuromuscular Electrical Stimulation Be Improved to Optimize Quadriceps Strengthening?Sports Health. 2016 Jan-Feb;8(1):79-85. doi: 10.1177/1941738115618174. Sports Health. 2016. PMID: 26582349 Free PMC article. Review.
Cited by
-
Comparison of oxygen uptake during cycle ergometry with and without functional electrical stimulation in patients with COPD: protocol for a randomised, single-blind, placebo-controlled, cross-over trial.BMJ Open Respir Res. 2016 Apr 12;3(1):e000130. doi: 10.1136/bmjresp-2016-000130. eCollection 2016. BMJ Open Respir Res. 2016. PMID: 27110364 Free PMC article.
-
Acute Effects of Whole-Body Electromyostimulation on Energy Expenditure at Resting and during Uphill Walking in Healthy Young Men.Metabolites. 2022 Aug 24;12(9):781. doi: 10.3390/metabo12090781. Metabolites. 2022. PMID: 36144186 Free PMC article.
-
Transcutaneous electrical stimulation on the anterior neck region: The impact of pulse duration and frequency on maximum amplitude tolerance and perceived discomfort.J Oral Rehabil. 2018 Jun;45(6):436-441. doi: 10.1111/joor.12625. Epub 2018 Mar 30. J Oral Rehabil. 2018. PMID: 29574920 Free PMC article.
-
The duty cycle in Functional Electrical Stimulation research. Part II: Duty cycle multiplicity and domain reporting.Eur J Transl Myol. 2018 Nov 7;28(4):7733. doi: 10.4081/ejtm.2018.7733. eCollection 2018 Nov 2. Eur J Transl Myol. 2018. PMID: 30662696 Free PMC article.
References
-
- Theurel J, Lepers R, Pardon L, Maffiuletti NA. Differences in cardiorespiratory and neuromuscular responses between voluntary and stimulated contractions of the quadriceps femoris muscle. Respir Physiol Neurobiol. 2006;157:341–347. - PubMed
-
- Hamada T, Sasaki H, Hayashi T, Moritani T, Nakao K. Enhancement of whole body glucose uptake during and after human skeletal muscle low-frequency electrical stimulation. J Appl Physiol. 2003;94:2107–2112. - PubMed
-
- Poole RB, Harrold CP, Burridge JH, Byrne CD, Holt RI. Electrical muscle stimulation acutely mimics exercise in neurologically intact individuals but has limited clinical benefits in patients with type 2 diabetes. Diabetes Obes Metab. 2005;7:344–351. doi: 10.1111/j.1463-1326.2004.00400.x. - DOI - PubMed
MeSH terms
LinkOut - more resources
Full Text Sources
Other Literature Sources
Miscellaneous
