. 2013 Oct;34(30):7281-91.
doi: 10.1016/j.biomaterials.2013.05.073. Epub 2013 Jun 27.

Differential and synergistic effects of mechanical stimulation and growth factor presentation on vascular wall function

Affiliations

Differential and synergistic effects of mechanical stimulation and growth factor presentation on vascular wall function

Mao-Shih Liang et al. Biomaterials. 2013 Oct.

Abstract

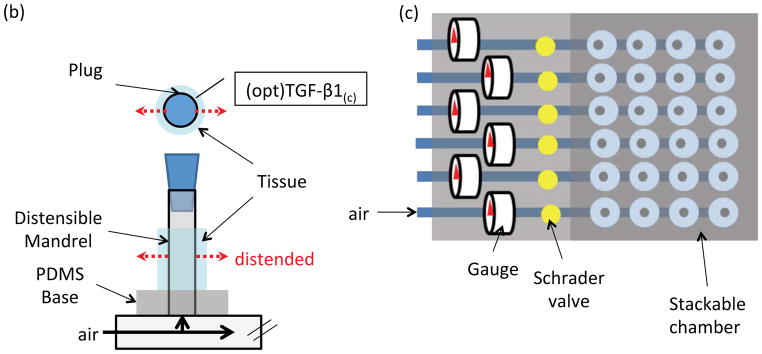
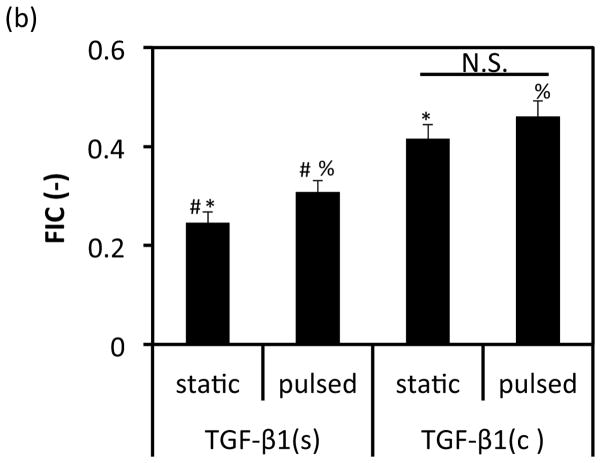
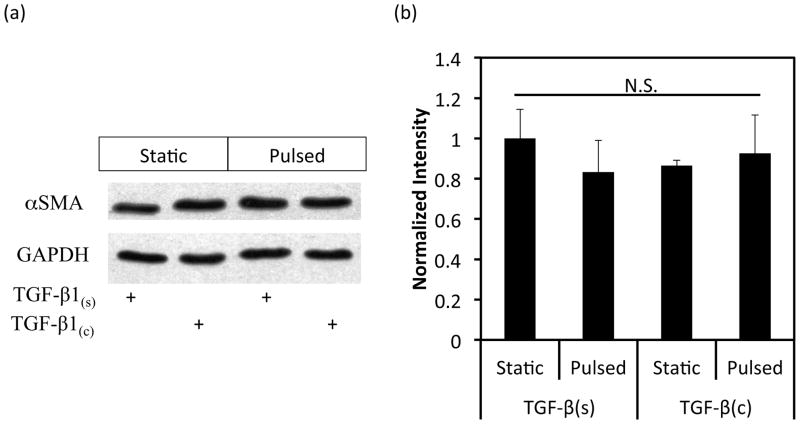
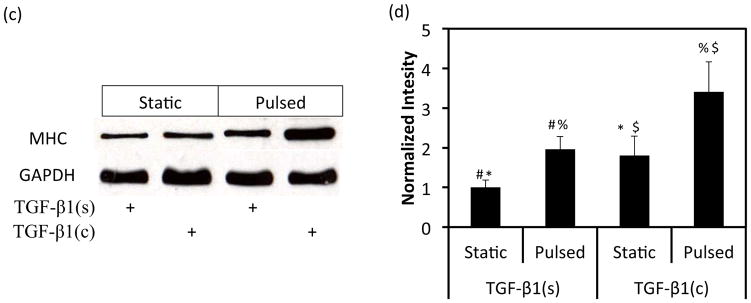
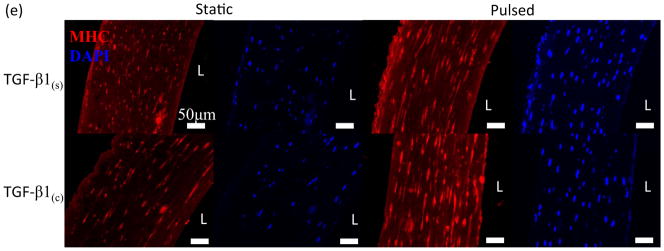
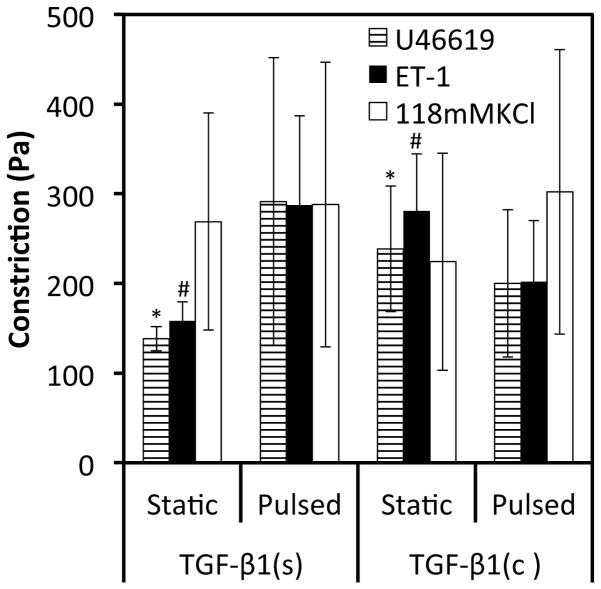
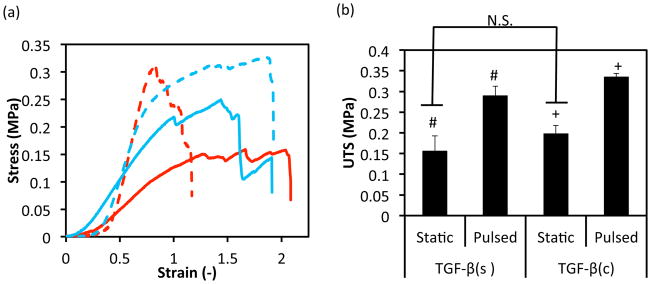
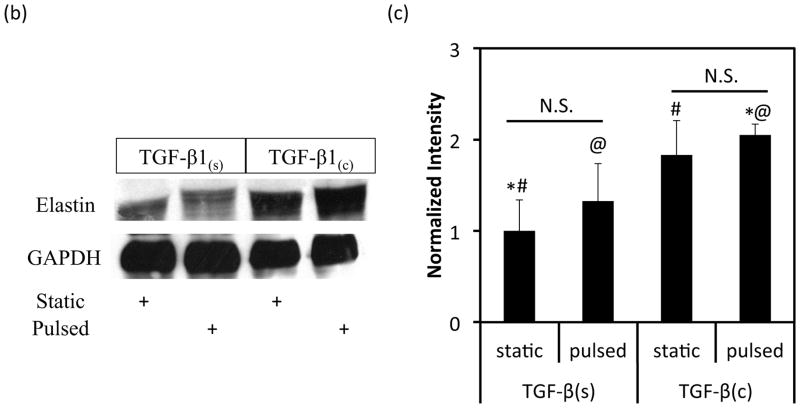
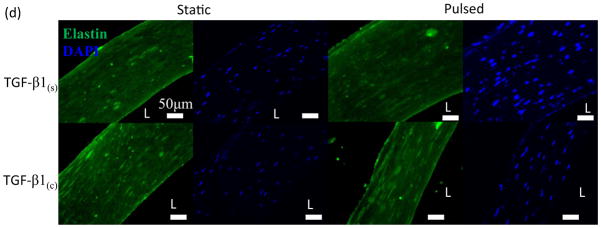
We investigated the hypothesis that immobilizing TGF-β1 within fibrin hydrogels may act in synergy with cyclic mechanical stimulation to enhance the properties of vascular grafts. To this end, we engineered a fusion TGF-β1 protein that can covalently anchor to fibrin during polymerization upon the action of factor XIII. We also developed a 24-well based bioreactor in which vascular constructs can be mechanically stimulated by distending the silastic mandrel in the middle of each well. TGF-β1 was either conjugated to fibrin or supplied in the culture medium and the fibrin-based constructs were cultured statically for a week followed by cyclic distention for another week. The tissues were examined for myogenic differentiation, vascular reactivity, mechanical properties and ECM content. Our results showed that some aspects of vascular function were differentially affected by growth factor presentation vs. pulsatile force application, while others were synergistically enhanced by both. Overall, this two-prong biomimetic approach improved ECM secretion, vascular reactivity and mechanical properties of vascular constructs. These findings may be applied in other tissue engineering applications such as cartilage, tendon or cardiac regeneration where growth factors TGF-β1 and mechano-stimulation play critical roles.

Keywords: Fibrin hydrogels; Growth factor presentation; Mechanical stimulation; Vascular contractility; Vascular tissue engineering.


Figures

Figure 1
Figure 1
TGF-β1 conjugation strategy and mechanical pulsation plate: (a) Schematic of FXIII mediated peptide/TGF-β1 protein immobilization into fibrin hydrogel. In the single fibrinogen molecule, E represents the E-domain; D represents the D-domains. (b) Schematic of each well: fibrin gel was polymerized around a distensible mandrel in the middle of each well. Compressed air was used to distend the mandrel as shown by the dashed arrows. A polycarbonate plug was used to seal the mandrel tubing. (c) Schematic of the plate. Four wells in a row were connected to a common air source and pulsed under identical conditions. Each plate had six independent rows, each pulsed under a different condition. (d) Distention controlling module: the compressed air was passed through a 0.22 μm filter before entering the system (not shown). A needle valve controlled the amount of air to achieve a certain pressure that was monitored by a pressure gauge. A custom-made electronic controller generating square-function signals was used to control the 3-way solenoid valve that determined the pulsation pattern (time on/time off). (e) Distention-pressure relationship was established by measuring the mandrel diameter as a function of pressure using a laser micrometer (second-order polynomial regression, R2>0.99).
Figure 1
Figure 1
TGF-β1 conjugation strategy and mechanical pulsation plate: (a) Schematic of FXIII mediated peptide/TGF-β1 protein immobilization into fibrin hydrogel. In the single fibrinogen molecule, E represents the E-domain; D represents the D-domains. (b) Schematic of each well: fibrin gel was polymerized around a distensible mandrel in the middle of each well. Compressed air was used to distend the mandrel as shown by the dashed arrows. A polycarbonate plug was used to seal the mandrel tubing. (c) Schematic of the plate. Four wells in a row were connected to a common air source and pulsed under identical conditions. Each plate had six independent rows, each pulsed under a different condition. (d) Distention controlling module: the compressed air was passed through a 0.22 μm filter before entering the system (not shown). A needle valve controlled the amount of air to achieve a certain pressure that was monitored by a pressure gauge. A custom-made electronic controller generating square-function signals was used to control the 3-way solenoid valve that determined the pulsation pattern (time on/time off). (e) Distention-pressure relationship was established by measuring the mandrel diameter as a function of pressure using a laser micrometer (second-order polynomial regression, R2>0.99).
Figure 2
Figure 2
Human neonatal fibroblasts were seeded at 3,000 cells/cm2 and cultured for four days in growth medium (GM) or in myogenic differentiation medium (DM) before immunostaining for αSMA, calponin or MHC (green). Cell nuclei were counterstained with Hoechst (blue). Scale bar = 20 μm.
Figure 3
Figure 3
Effects of TGF-β1 conjugation and mechanical stimulation on cell distribution and alignment. (a) Immunostaining of vascular constructs for αSMA. Cell nuclei were counterstained with Hoechst (blue). L: depicts the lumen side; Scale bar = 100 μm. (b) Florescence intensity center (FIC) at the indicated conditions. All values represent the mean ± SD of triplicate samples in a representative experiment (n=3). The signs (#, *, %) denote statistical significance (p<0.05) between the indicated samples. N.S.: not significant (p≥0.05).
Figure 3
Figure 3
Effects of TGF-β1 conjugation and mechanical stimulation on cell distribution and alignment. (a) Immunostaining of vascular constructs for αSMA. Cell nuclei were counterstained with Hoechst (blue). L: depicts the lumen side; Scale bar = 100 μm. (b) Florescence intensity center (FIC) at the indicated conditions. All values represent the mean ± SD of triplicate samples in a representative experiment (n=3). The signs (#, *, %) denote statistical significance (p<0.05) between the indicated samples. N.S.: not significant (p≥0.05).
Figure 4
Figure 4
Effects of TGF-β1 conjugation and mechanical stimulation on expression of SMC proteins. (a) WB of TEV lysates for αSMA; GAPDH served as loading control. (b) Quantification of the band intensity in (a) using Image J. The intensity of each αSMA intensity was normalized to that of the corresponding GAPDH and the ratio was normalized to the ratio of the TGF-β1(s)-static group. (c) WB of TEV lysates for MHC; GAPDH served as loading control. (d) Quantification of the band intensity in (c) was done as described in (b). (e) Immunostaining of vascular constructs for MHC (red). Cell nuclei were counterstained with Hoechst (blue). L: depicts the lumen side; Scale bar = 50 μm. (b, d) All values represent the mean ± SD of triplicate samples in a representative experiment (n=3). The symbols (#, *, %, $) denote statistical significance (p<0.05) between the indicated samples. N.S.: not significant (p≥0.05).
Figure 4
Figure 4
Effects of TGF-β1 conjugation and mechanical stimulation on expression of SMC proteins. (a) WB of TEV lysates for αSMA; GAPDH served as loading control. (b) Quantification of the band intensity in (a) using Image J. The intensity of each αSMA intensity was normalized to that of the corresponding GAPDH and the ratio was normalized to the ratio of the TGF-β1(s)-static group. (c) WB of TEV lysates for MHC; GAPDH served as loading control. (d) Quantification of the band intensity in (c) was done as described in (b). (e) Immunostaining of vascular constructs for MHC (red). Cell nuclei were counterstained with Hoechst (blue). L: depicts the lumen side; Scale bar = 50 μm. (b, d) All values represent the mean ± SD of triplicate samples in a representative experiment (n=3). The symbols (#, *, %, $) denote statistical significance (p<0.05) between the indicated samples. N.S.: not significant (p≥0.05).
Figure 5
Figure 5
Conjugation of TGF-β1 improved vascular contractility. The force of contraction was measured in response to receptor mediated (U46619 and Endothelin-1) and non-receptor mediated (KCl) vasoconstrictors. All values represent the mean ± SD of triplicate samples in a representative experiment (n=3). The symbols (#, *) denote statistical significance (p<0.05) between the indicated samples.
Figure 6
Figure 6
Effects of TGF-β1 conjugation and mechanical stimulation on mechanical properties of vascular grafts. (a) Representative stress-strain curves of TEVs under different treatments. Red lines represent TEVs cultured with soluble TGF-β1(s) and blue lines represent samples with conjugated TGF-β1(c). Solid lines represent samples in static culture for two weeks while dash lines represent TEVs with one week static culture followed by one week under pulsation at 5.5% distention. (b) Ultimate tensile stress (UTS); (c) Young’s moduli; and (d) Strain at rupture. All values represent the mean ± SD of triplicate samples in a representative experiment (n=3). The symbols (#, +) denote statistical significance (p<0.05) between the indicated samples. N.S.: not significant (p≥0.05).
Figure 6
Figure 6
Effects of TGF-β1 conjugation and mechanical stimulation on mechanical properties of vascular grafts. (a) Representative stress-strain curves of TEVs under different treatments. Red lines represent TEVs cultured with soluble TGF-β1(s) and blue lines represent samples with conjugated TGF-β1(c). Solid lines represent samples in static culture for two weeks while dash lines represent TEVs with one week static culture followed by one week under pulsation at 5.5% distention. (b) Ultimate tensile stress (UTS); (c) Young’s moduli; and (d) Strain at rupture. All values represent the mean ± SD of triplicate samples in a representative experiment (n=3). The symbols (#, +) denote statistical significance (p<0.05) between the indicated samples. N.S.: not significant (p≥0.05).
Figure 7
Figure 7
Effects of TGF-β1 conjugation and mechanical stimulation on ECM deposition. (a) Collagen content was measured by the hydroxyproline assay. (b) WB of TEV lysates for elastin; GAPDH served as loading control. (c) Quantification of the bands in (b) using Image J. The intensity of each αSMA intensity normalized to that of the corresponding GAPDH and the ratio was normalized to the ratio of the TGF-β1(s)-static group. (d) Immunostaining of vascular constructs for elastin (green). Cell nuclei were counterstained with Hoechst (blue). Scale bar = 50 μm. (a, c) All values represent the mean ± SD of triplicate samples in a representative experiment (n=3). The symbols (#, +, *, @) denote statistical significance (p<0.05) between the indicated samples. N.S.: not significant (p≥0.05).
Figure 7
Figure 7
Effects of TGF-β1 conjugation and mechanical stimulation on ECM deposition. (a) Collagen content was measured by the hydroxyproline assay. (b) WB of TEV lysates for elastin; GAPDH served as loading control. (c) Quantification of the bands in (b) using Image J. The intensity of each αSMA intensity normalized to that of the corresponding GAPDH and the ratio was normalized to the ratio of the TGF-β1(s)-static group. (d) Immunostaining of vascular constructs for elastin (green). Cell nuclei were counterstained with Hoechst (blue). Scale bar = 50 μm. (a, c) All values represent the mean ± SD of triplicate samples in a representative experiment (n=3). The symbols (#, +, *, @) denote statistical significance (p<0.05) between the indicated samples. N.S.: not significant (p≥0.05).

Similar articles

Cited by

References

    1. Niklason LE, Abbott W, Gao J, Klagges B, Hirschi KK, Ulubayram K, et al. Morphologic and mechanical characteristics of engineered bovine arteries. J Vasc Surg. 2001;33:628–38. - PubMed
    1. Niklason LE, Gao J, Abbott WM, Hirschi KK, Houser S, Marini R, et al. Functional arteries grown in vitro. Science. 1999;284:489–93. - PubMed
    1. Wu W, Allen RA, Wang Y. Fast-degrading elastomer enables rapid remodeling of a cell-free synthetic graft into a neoartery. Nat Med. 2012;18:1148–53. - PMC - PubMed
    1. Stegemann JP, Hong H, Nerem RM. Mechanical, biochemical, and extracellular matrix effects on vascular smooth muscle cell phenotype. J Appl Physiol. 2005;98:2321–7. - PubMed
    1. Stegemann JP, Nerem RM. Phenotype modulation in vascular tissue engineering using biochemical and mechanical stimulation. Ann Biomed Eng. 2003;31:391–402. - PubMed

Publication types

Substances