. 2013 Jul 3;154(1):240-51.
doi: 10.1016/j.cell.2013.06.009. Epub 2013 Jun 27.

Ribosome profiling provides evidence that large noncoding RNAs do not encode proteins

Affiliations

Ribosome profiling provides evidence that large noncoding RNAs do not encode proteins

Mitchell Guttman et al. Cell. .

Abstract

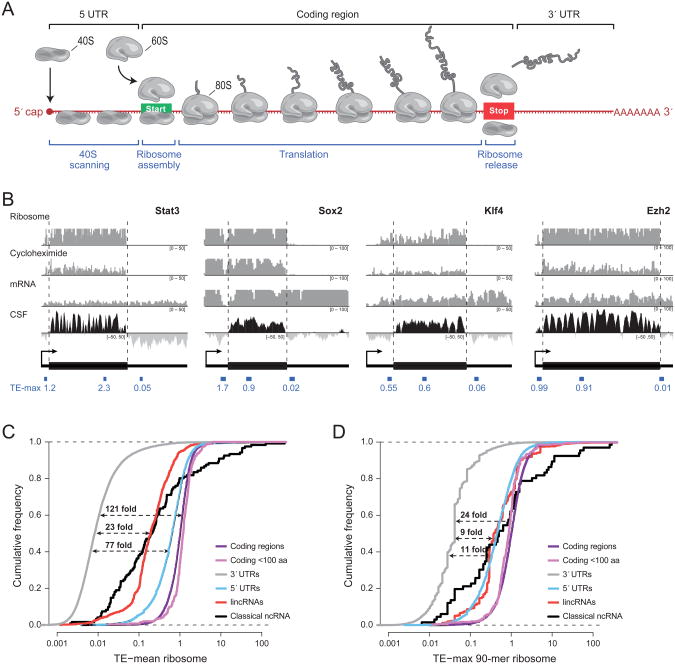
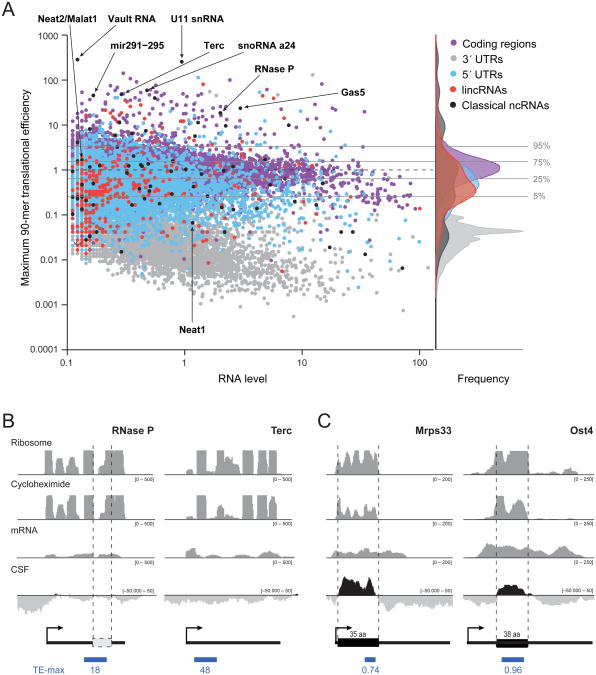
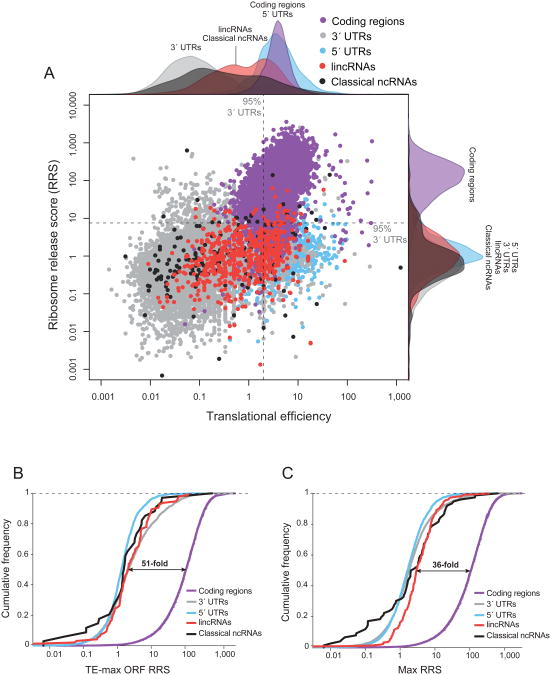
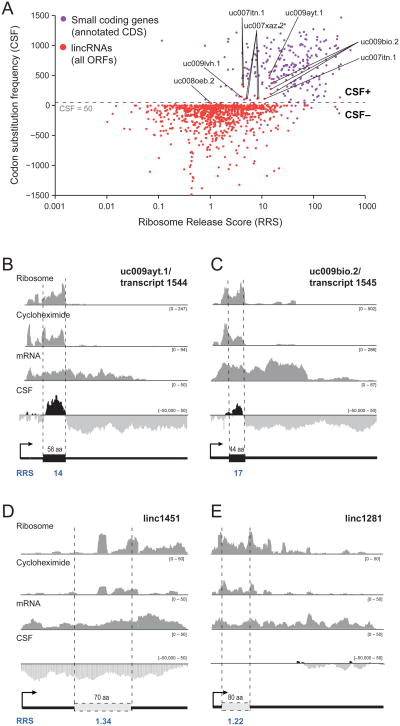
Large noncoding RNAs are emerging as an important component in cellular regulation. Considerable evidence indicates that these transcripts act directly as functional RNAs rather than through an encoded protein product. However, a recent study of ribosome occupancy reported that many large intergenic ncRNAs (lincRNAs) are bound by ribosomes, raising the possibility that they are translated into proteins. Here, we show that classical noncoding RNAs and 5' UTRs show the same ribosome occupancy as lincRNAs, demonstrating that ribosome occupancy alone is not sufficient to classify transcripts as coding or noncoding. Instead, we define a metric based on the known property of translation whereby translating ribosomes are released upon encountering a bona fide stop codon. We show that this metric accurately discriminates between protein-coding transcripts and all classes of known noncoding transcripts, including lincRNAs. Taken together, these results argue that the large majority of lincRNAs do not function through encoded proteins.


Figures

Figure 1
Figure 1. Properties of the translational efficiency score
(a) An overview of mRNA translation. (b) Examples of ribosome profiling data over four mRNAs: Stat3, Sox2, Klf4, and Ezh2. The first three rows show, respectively, the sequencing coverage in counts (y-axis) of the ribosome-associated fraction, ribosome-associated fraction after treatment with cycloheximide, and polyA-selected total RNA per nucleotide (x-axis) on the associated transcript. The fourth row shows the codon substitution frequency (CSF) score across the mRNA which indicates the degree to which the sequence shows the evolutionary conservation pattern expected in protein-coding regions. Black corresponds to conserved coding potential (CSF>0) and light grey to lack of conserved coding potential (CSF<0). Dashed lines correspond to the boundaries of the coding region of the mRNA and the location and score of the max 90-mer translational efficiency (TE) score is shown for the 5′-UTR, 3′-UTR (thin black boxes), and coding region (thick black boxes). (c) Cumulative distribution of the average TE score across coding regions (purple line), small coding regions (magenta line), 3′-UTRs (gray line), 5′-UTRs (blue line), classical ncRNAs (black line), and lincRNAs (red line). The dashed lines show the median separation relative to 3′-UTRs for 5′-UTRs (bottom), lincRNAs and classical ncRNAs (middle line), and coding regions (top line). (d) Cumulative distribution of the TE computed using the max 90-mer window across the same classes. See also Figure S1.
Figure 2
Figure 2. Translational efficiency of the maximum 90-mer fails to separate translated and non-translated RNAs
(a) Scatter plot of RNA expression (log scale, x-axis) compared to the TE of the maximum 90-mer (log scale, y-axis) for coding regions (purple dots), 3′-UTRs (gray dots), 5′-UTRs (blue dots), classical ncRNAs (black dots), and lincRNAs (red dots). Horizontal lines correspond to the indicated percentiles of the TE-max score for protein-coding regions. The overlaid density distributions of the TE-max scores for each feature are shown. (b) Two examples of classical ncRNAs that have very high translational efficiency scores: RNase P and the telomerase RNA (Terc). The four rows (ribosome, cycloheximide, mRNA and CSF) are as described in legend of Figure 1. Beneath is an ideogram of the RNA, the location of a potential ORF (white box), and score of the maximum 90-mer (blue box). (c) Examples of two small coding genes encoding 35- and 38-amino acid peptides. See also Figure S2.
Figure 3
Figure 3. Ribosome release score separates translated and non-translated RNAs
(a) Scatter plot of the TE-mean score for each ORF (log scale, x-axis) compared to its ribosome release score (log scale, y-axis) for coding genes (purple), 5′-UTRs (blue), 3′-UTRs (gray), classical ncRNAs (black), and lincRNAs (red). For known coding regions, we show the annotated ORF and for all other features we computed all possible ORFs (see Methods). The TE-mean score reflects the mean over each ORF. The dashed lines represent the 95th percentile of 3′-UTR values. Along each axis, all points are summarized using an overlaid density plot. (b) Cumulative density distribution of the RRS for the putative ORF with the highest ribosome occupancy (see Methods) for protein-coding regions (purple), 3′-UTRs (gray), 5′-UTRs (blue), classical ncRNAs (black), and lincRNAs (red). The dashed line indicates the fold difference between the median score for lincRNAs and protein-coding regions. (c) A cumulative density distribution of the maximum RRS over any ORF within a transcript (see Methods). See also Figure S3.
Figure 4
Figure 4. Ribosome release separates lincRNAs from small coding genes
(a) A scatter plot of the RRS (log scale, x-axis) versus the CSF (y-axis) is plotted for each ORF of the lincRNAs (red points) and known small peptides (purple points). The dashed line corresponds to a CSF score of 50, the cutoff used to define a CSF+ set (CSF≥50) and CSF- set (CSF<50) (see Methods). (b) An example of a representative CSF+ transcript encoding a likely 58 amino acid protein with an RRS of 14. The four rows (ribosome, cycloheximide, mRNA and CSF) are as described in legend of Figure 1. The RRS score is noted in blue beneath the ideogram. (c) Another representative CSF+ transcript encoding a likely 44 amino acid protein with an RRS of 17. (d) A representative CSF- transcript, linc1451. The putative ORF (white) is defined as the ORF with the highest ribosome occupancy and has an RRS of 1.34. (e) Another representative CSF-transcript, linc1281. The putative ORF (white) has an RRS of 1.22. See also Figure S4.

Comment in

References

    1. Banfai B, Jia H, Khatun J, Wood E, Risk B, Gundling WE, Jr, Kundaje A, Gunawardena HP, Yu Y, Xie L, et al. Long noncoding RNAs are rarely translated in two human cell lines. Genome Res. 2012;22:1646–1657. - PMC - PubMed
    1. Bartel DP. MicroRNAs: genomics, biogenesis, mechanism, and function. Cell. 2004;116:281–297. - PubMed
    1. Birney E, Stamatoyannopoulos JA, Dutta A, Guigo R, Gingeras TR, Margulies EH, Weng Z, Snyder M, Dermitzakis ET, Thurman RE, et al. Identification and analysis of functional elements in 1% of the human genome by the ENCODE pilot project. Nature. 2007;447:799–816. - PMC - PubMed
    1. Carninci P, Kasukawa T, Katayama S, Gough J, Frith MC, Maeda N, Oyama R, Ravasi T, Lenhard B, Wells C, et al. The transcriptional landscape of the mammalian genome. Science. 2005;309:1559–1563. - PubMed
    1. Carvunis AR, Rolland T, Wapinski I, Calderwood MA, Yildirim MA, Simonis N, Charloteaux B, Hidalgo CA, Barbette J, Santhanam B, et al. Proto-genes and de novo gene birth. Nature. 2012;487:370–374. - PMC - PubMed

Publication types