. 2013 Oct;132(4):922-32.e1-16.
doi: 10.1016/j.jaci.2013.05.004. Epub 2013 Jun 26.

Rapid desensitization induces internalization of antigen-specific IgE on mouse mast cells

Affiliations

Rapid desensitization induces internalization of antigen-specific IgE on mouse mast cells

Tatsuya Oka et al. J Allergy Clin Immunol. 2013 Oct.

Abstract

Background: Rapid desensitization transiently prevents severe allergic reactions, allowing administration of life-saving therapies in previously sensitized patients. However, the mechanisms underlying successful rapid desensitization are not fully understood.

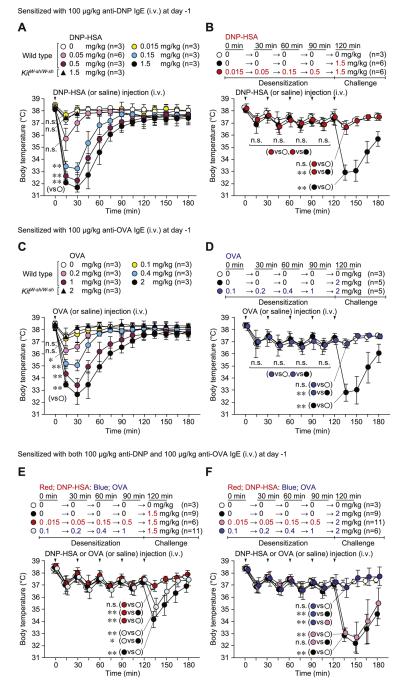
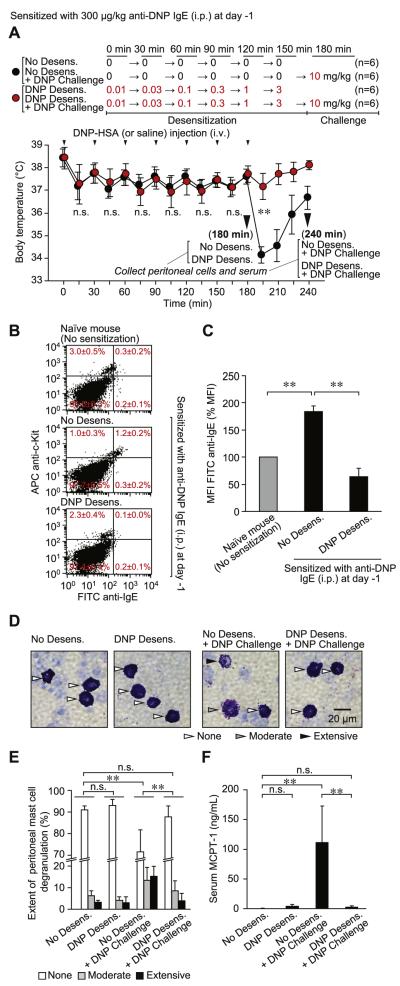
Objectives: We sought to investigate whether the mast cell (MC) is an important target of rapid desensitization in mice sensitized to exhibit IgE-dependent passive systemic anaphylaxis in vivo and to investigate the antigen specificity and underlying mechanisms of rapid desensitization in our mouse model.

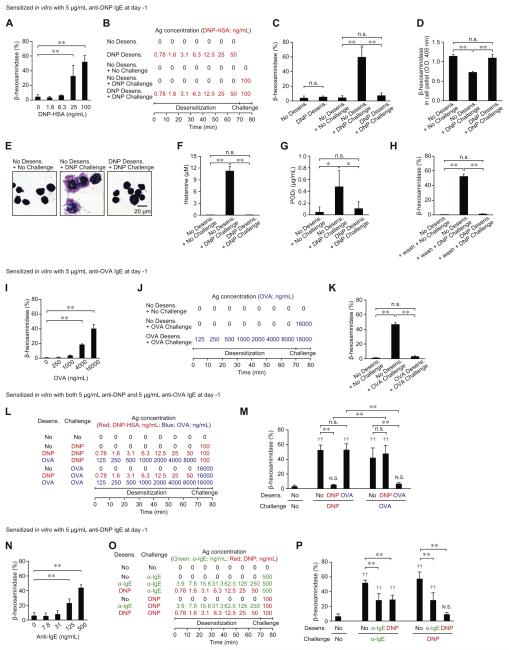
Methods: C57BL/6 mice (in vivo) or primary isolated C57BL/6 mouse peritoneal mast cells (PMCs; in vitro) were passively sensitized with antigen-specific anti-2,4-dinitrophenyl IgE, anti-ovalbumin IgE, or both. MCs were exposed over a short period of time to increasing amounts of antigen (2,4-dinitrophenyl-human serum albumin or ovalbumin) in the presence of extracellular calcium in vitro or by means of intravenous administration to sensitized mice in vivo before challenging the mice with or exposing the PMCs to optimal amounts of specific or irrelevant antigen.

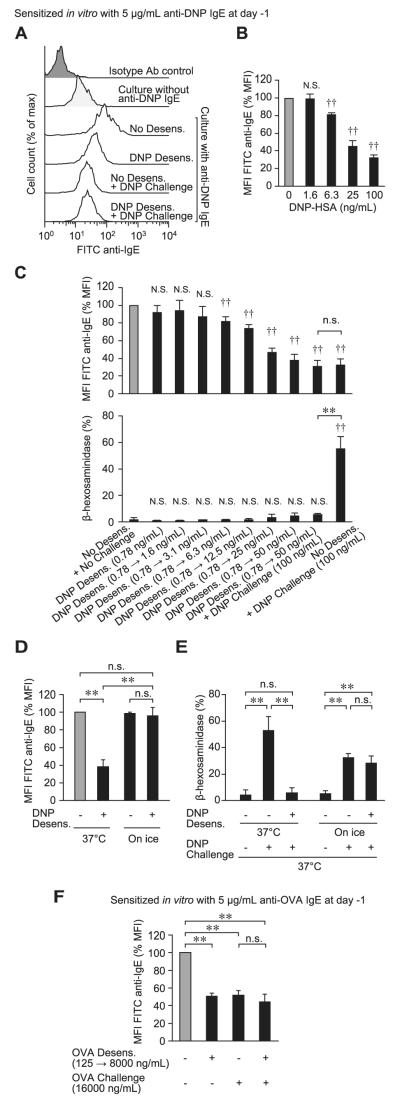
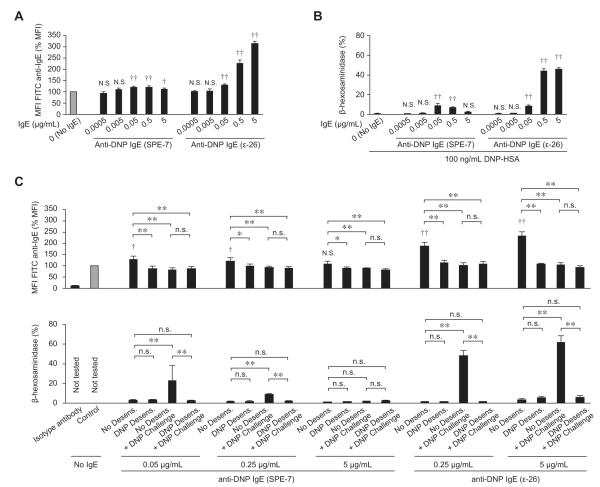
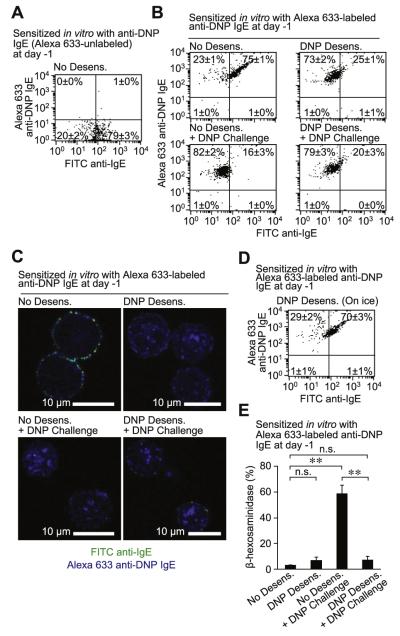
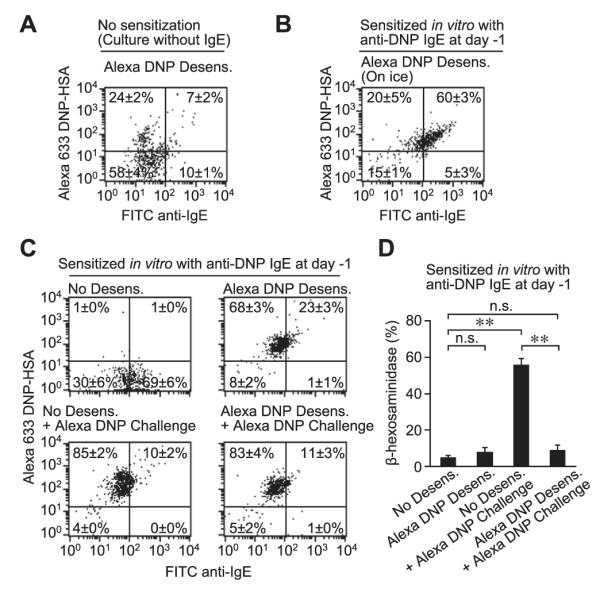
Results: Rapidly exposing mice or PMCs to progressively increasing amounts of specific antigen inhibited the development of antigen-induced hypothermia in sensitized mice in vivo and inhibited antigen-induced PMC degranulation and prostaglandin D2 synthesis in vitro. Such MC hyporesponsiveness was induced antigen-specifically and was associated with a significant reduction in antigen-specific IgE levels on MC surfaces.

Conclusions: Rapidly exposing MCs to progressively increasing amounts of antigen can both enhance the internalization of antigen-specific IgE on the MC surface and also desensitize these cells in an antigen-specific manner in vivo and in vitro.

Keywords: 2,4-Dinitrophenyl; Anaphylaxis; BMCMC; Bone marrow–derived cultured mast cell; DNP; FITC; Fluorescein isothiocyanate; HSA; Human serum albumin; IgE; MC; MCPT-1; MFI; Mast cell; Mast cell protease 1; Mean fluorescence intensity; OVA; Ovalbumin; PGD(2); PMC; PSA; Passive systemic anaphylaxis; Peritoneal mast cell; Prostaglandin D(2); STAT6; Signal transducer and activator of transcription 6; antigen; basophil; degranulation; desensitization; mast cell; rapid desensitization; receptor internalization; rush desensitization.


Figures

FIG 1
FIG 1
Rapid desensitization can prevent PSA reactions in vivo. Mice were sensitized (intravenously) with 100 μg/kg anti-DNP (A and B), 100 μg/kg anti-OVA (C and D), or both anti-DNP and anti-OVA (total of 200 μg/kg, E and F) IgE. Body temperature was measured after a single challenge (intravenously) with DNP-HSA (Fig 1, A) or OVA (Fig 1, C). Fig 1, B, D, E, and F, Body temperature was measured at the indicated times points after injection (intravenous) with sequentially increasing amounts (Desensitization) or a target dose (Challenge) of DNP-HSA or OVA. N = 3 to 11 mice per group from at least 3 independent experiments, each of which produced similar results. **P < .01, *P < .05, and n.s. (not significant, P > .05). i.v., Intravenously. Body temperatures at 15 minutes (Fig 1, A and C); at 15, 45, 75, 105, and 135 minutes (Fig 1, B and D); or at 135 minutes (Fig 1, E and F) in each group were compared by using 1-way ANOVA, followed by the Bonferroni test.
FIG 2
FIG 2
Rapid desensitization of MCs in vitro. Purified PMCs were sensitized with anti-DNP (A-H and N-P), anti-OVA (I-K), or both anti-DNP and anti-OVA (L and M) IgE. Percentage of β-hexosaminidase release was measured after a single challenge with DNP-HSA (Fig 2, A), OVA (Fig 2, I), or anti-IgE antibody (α-IgE; Fig 2, N). Effects of desensitizing PMCs with sequentially increasing concentrations of DNP-HSA, OVA, or α-IgE (using experimental protocols shown in Fig 2, B, J, L, and O and Fig E3) on β-hexosaminidase release (Fig 2, C, H, K, M, and P), β-hexosaminidase remaining in the cell pellet (Fig 2, D), morphology of Giemsa-stained PMCs (Fig 2, E), histamine release (Fig 2, F), or PGD2 production (Fig 2, G) without (A-G and I-P) or with (Fig 2, H) washing the media before antigen challenge are shown. N = 6 to 9 mice per group from 2 to 3 independent experiments, each of which produced similar results. **P < .01, *P < .05, and n.s. (not significant, P > .05) for comparisons between indicated groups.‡P < .01 and N.S. (not significant, P > .05) versus the No Desens. + No Challenge group.
FIG 3
FIG 3
Diminished surface IgE levels on MCs after rapid desensitization in vivo. Mice were sensitized (intraperitoneally) with 300 μg/kg anti-DNP IgE. A, Body temperature was measured at the indicated time points after injection (intravenously) with sequentially increasing amounts (Desensitization) or a target dose (Challenge) of DNP-HSA. B-F, Peritoneal cells and sera were collected from mice at the 180-minute time point (before challenge with 10 mg/kg DNP-HSA, n = 6; Fig 3, B-F) or at the 240-minute time point (after challenge with 10 mg/kg DNP-HSA, n = 6; Fig 3, D-F). Fig 3, B, Representative dot plots of surface IgE levels and c-Kit expression on peritoneal cells isolated from individual naive (No sensitization) or anti-DNP IgE–sensitized mice without (No Desens.) or with (DNP Desens.) desensitization at 180 minutes in Fig 3, A (before DNP-HSA challenge). We tested 3 (Naive) or 6 (No Desens. and DNP Desens.) mice, each of which produced similar results. The average percentage of cells in each quadrant from 3 (Naive) or 6 (No Desens. and DNP Desens.) individual mice is shown in red. Fig 3, C, MFI of cell-surface IgE molecules in c-Kit PMCs in Fig 3, B. Data were normalized by using MFI from naive mice as 100%. Fig 3, D, Representative Giemsa-stained cytospin preparations showing PMCs (arrowheads). Fig 3, E, Extent of PMC degranulation. The percentage of MCs exhibiting extensive (>50% of granules in that cell exhibiting evidence of degranulation), moderate (10% to 50% of granules affected), or no (none; <10% granules affected) degranulation was quantified by using Giemsa-stained slides, as in Fig 3, D. Fig 3, F, MCPT-1 concentrations in mouse serum. In Fig 3, D through F, samples from both the 180-minute (before DNP-HSA challenge) and 240-minute (after DNP-HSA challenge) time points (from mice in Fig 3, A) were analyzed. N = 6 samples per group from 3 independent experiments, each of which produced similar results. **P < .01 and n.s. (not significant, P > .05). Fig 3, A, Body temperatures at 15, 45, 75, 105, 135, 165, or 195 minutes in each group were compared by using the unpaired Student t test. i.p., Intraperitoneally; i.v., intravenously.
FIG 4
FIG 4
Reduction of IgE levels on PMC surfaces after rapid desensitization in vitro. Primary isolated PMCs were sensitized with anti-DNP (A-E) or anti-OVA (F) IgE and treated with DNP-HSA (Fig 4, A-E) or OVA (Fig 4, F) by using the desensitization protocol shown in Fig E3. Fig 4, A, Representative histograms showing surface IgE levels on PMCs. Fig 4, B, MFI of cell-surface IgE after challenge with a single dose of DNP-HSA. Fig 4, C, MFI of cell-surface IgE (upper panel) or β-hexosaminidase release (lower panel) after each step. Fig 4, D, MFI of cell-surface IgE after desensitization protocol at 37°C or on ice. Fig 4, E, Percentage of β-hexosaminidase release after DNP-HSA challenge (37°C) in PMCs subjected to the desensitization protocol at 37°C or on ice. Fig 4, F, MFI of cell-surface IgE after desensitization and challenge with OVA. Fig 4, B, C, D, and F, MFI data were normalized by using MFI from unstimulated cells (gray bars) as 100%. N = 3 to 9 samples per group from 2 to 3 independent experiments, each using PMCs pooled from 3 to 5 mice. **P < .01 and n.s. (not significant, P > .05) for comparisons between indicated groups. ‡P < .01 and N.S. (not significant, P > .05) versus 0 ng/mL (Fig 4, B) and the No Desens. + No Challenge (Fig 4, C) group, respectively.
FIG 5
FIG 5
Internalization of SPE-7 anti-DNP IgE in the absence of specific antigen. Primary isolated PMCs were sensitized without or with anti-DNP IgE clone SPE-7 (Sigma) or clone ε-26 for 16 to 24 hours. A, MFI of cell-surface IgE after sensitization. B, DNP-HSA (100 ng/mL)–induced β-hexosaminidase release. C, MFI of cell-surface IgE (upper panel) or β-hexosaminidase release (lower panel) measured after desensitization, as shown in Fig E3. The MFI data were normalized by using MFI from No IgE Control group cells (gray bars) as 100%. N = 4 to 5 samples per group from at least 2 independent experiments, each using PMCs pooled from 3 to 5 mice. **P < .01, *P < .05, and n.s. (not significant, P > .05) for comparisons between indicated groups. ‡P < .01, †P < .05, and N.S. (not significant, P > .05) versus the No IgE Control group.
FIG 6
FIG 6
Internalization of IgE during rapid desensitization. Primary isolated PMCs were sensitized with Alexa Fluor 633–unlabeled (A) or Alexa Fluor 633–labeled (B-E) anti-DNP IgE and then desensitized (0.78 → 50 ng/mL) and challenged (100 ng/mL) with DNP-HSA at 37°C (Fig 6, A-C and E) or on ice (Fig 6, D) by using the protocol in Fig E3. Representative flow cytometric dot plots (Fig 6, A, B, and D) or confocal microscopic images (Fig 6, C) showing staining for cell-surface IgE (detected with FITC anti-IgE) and Alexa Fluor 633–labeled anti-DNP IgE. Fig 6, E, β-Hexosaminidase release from PMCs stimulated as in Fig 6, B. Fig 6, A, B, and D, Four samples per group from 2 independent experiments, each using PMCs pooled from 3 to 5 mice; the average percentage of cells in each quadrant is shown. Fig 6, C, Four images per group from 2 independent experiments, each using PMCs pooled from 3 to 5 mice, were examined; one representative image is shown. **P < .01 and n.s. (not significant, P > .05).
FIG 7
FIG 7
Internalization of antigen during rapid desensitization. Primary isolated PMCs were sensitized without (A) or with (B-D) anti-DNP IgE. The PMCs were desensitized (0.78 → 50 ng/mL) and challenged (100 ng/mL) with Alexa Fluor 633–labeled DNP-HSA at 37°C (Fig 7, A, C, and D) or on ice (Fig 7, B) by using the protocol in Fig E3. Fig 7, A through C, Representative dot plots showing staining for cell-surface IgE (detected by using FITC anti-IgE) and Alexa Fluor 633–labeled DNP-HSA. Fig 7, D, β-Hexosaminidase release from cells stimulated as in Fig 7, C. Fig 7, A-D, Four samples per group from 2 independent experiments, each using PMCs pooled from 3 to 5 mice; the average percentage of cells in each quadrant in shown. **P < .01 and n.s. (not significant, P > .05).

References

    1. Metcalfe DD, Baram D, Mekori YA. Mast cells. Physiol Rev. 1997;77:1033–79. - PubMed
    1. Turner H, Kinet JP. Signalling through the high-affinity IgE receptor Fc epsilonRI. Nature. 1999;402:B24–30. - PubMed
    1. Rivera J, Gilfillan AM. Molecular regulation of mast cell activation. J Allergy Clin Immunol. 2006;117:1214–26. - PubMed
    1. Galli SJ, Tsai M. IgE and mast cells in allergic disease. Nat Med. 2012;18:693–704. - PMC - PubMed
    1. Ring J, Grosber M, Mohrenschlager M, Brockow K. Anaphylaxis: acute treatment and management. Chem Immunol Allergy. 2010;95:201–10. - PubMed

Publication types