. 2013 Jul 15;26(1):9-18.
doi: 10.1016/j.devcel.2013.05.024. Epub 2013 Jun 27.

The scaffold protein Atg11 recruits fission machinery to drive selective mitochondria degradation by autophagy

Affiliations

The scaffold protein Atg11 recruits fission machinery to drive selective mitochondria degradation by autophagy

Kai Mao et al. Dev Cell. .

Abstract

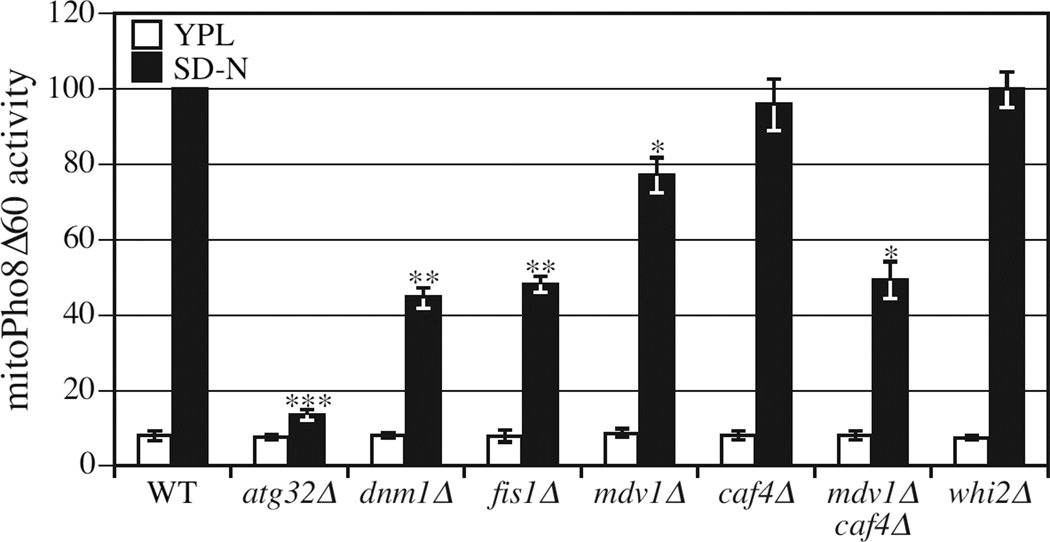
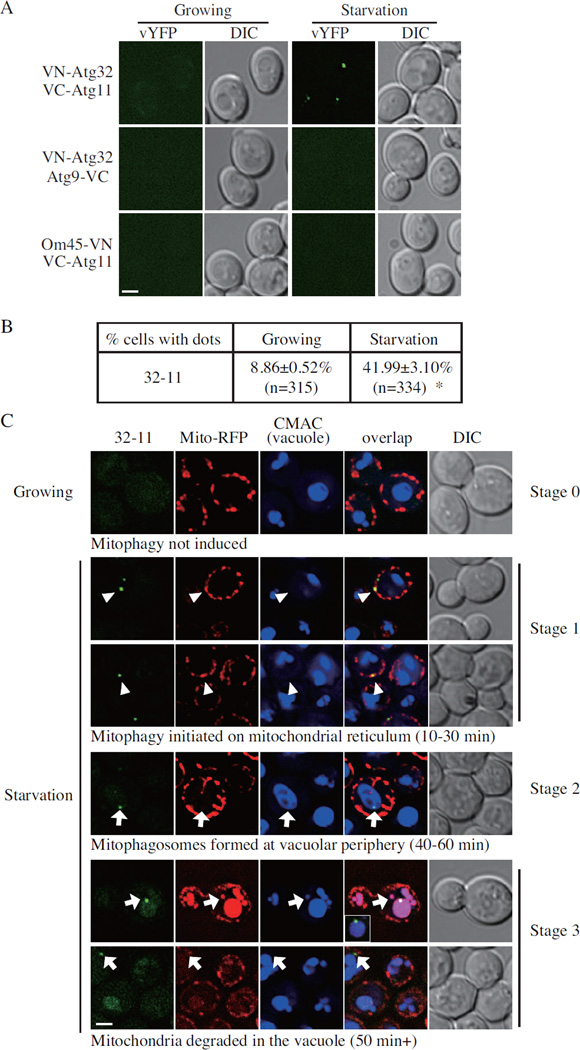
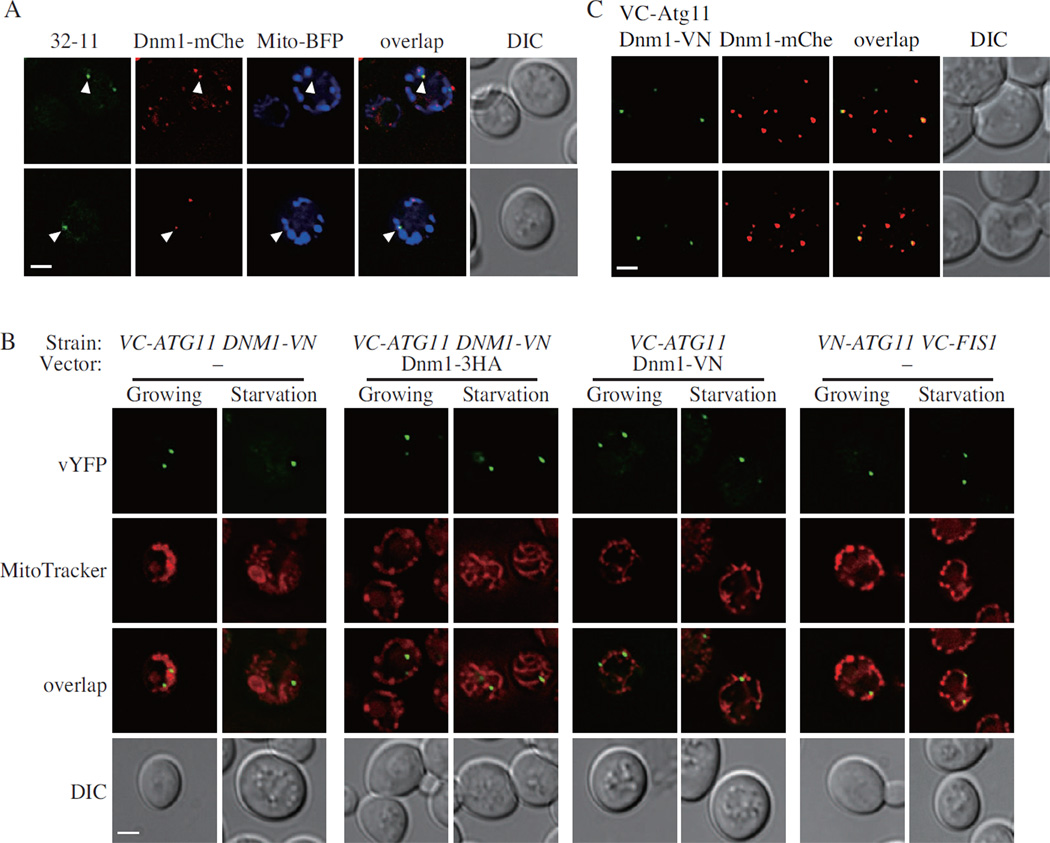
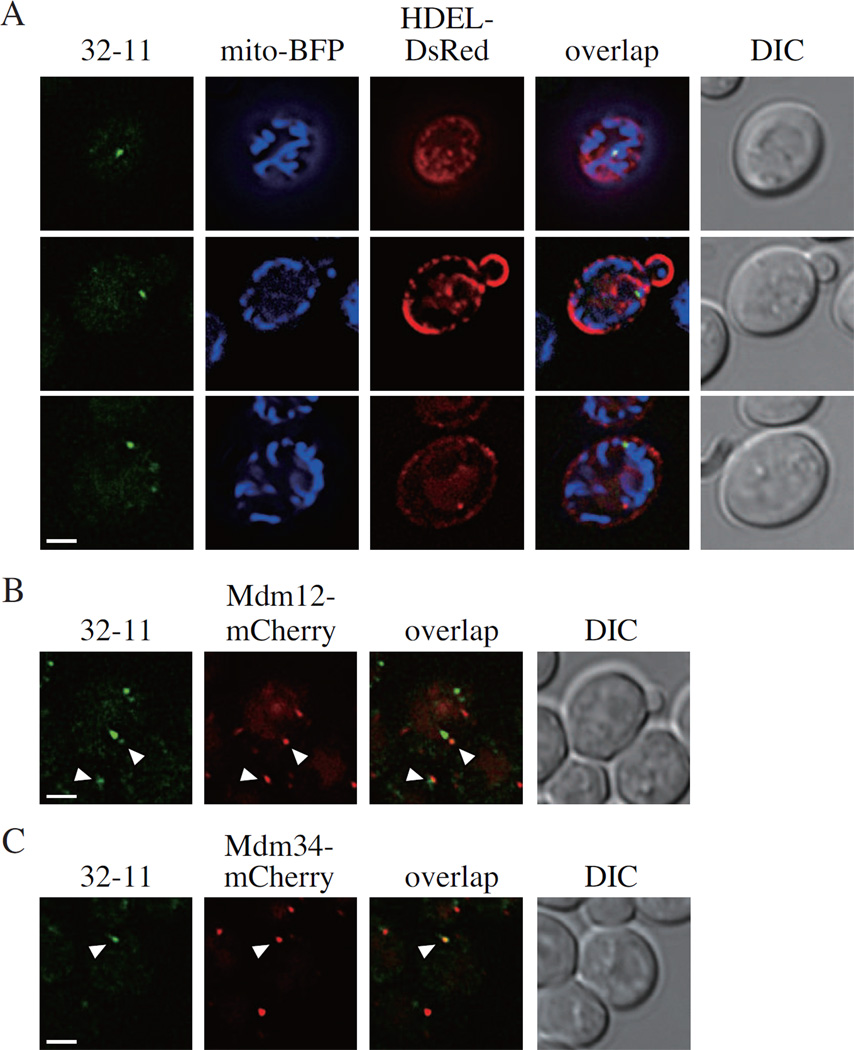
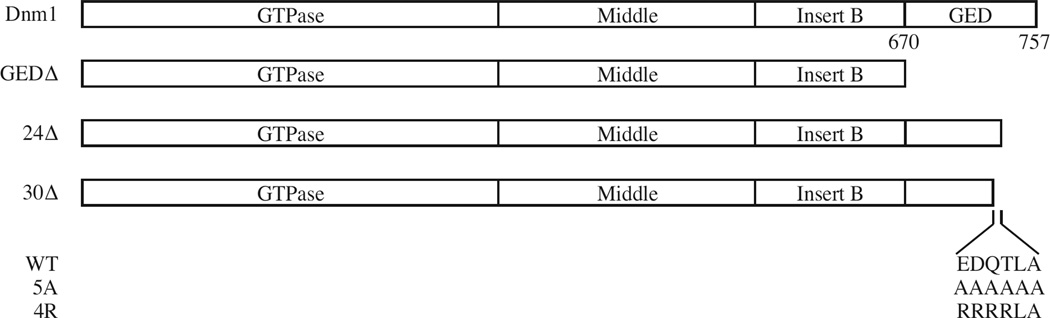
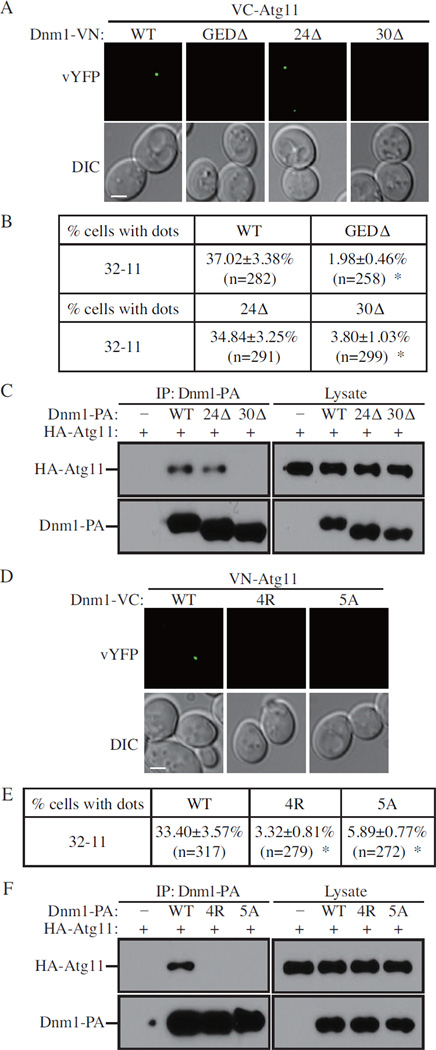
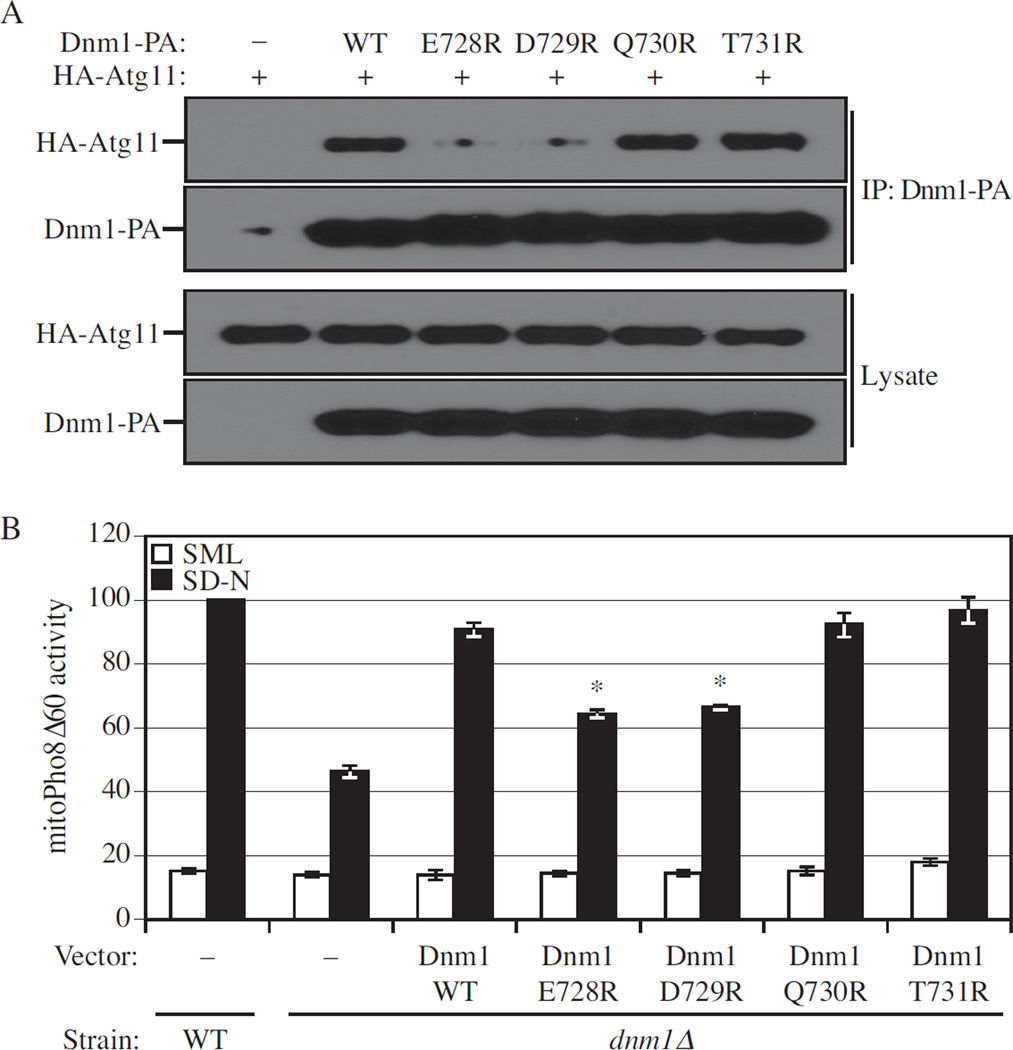
As the cellular power plant, mitochondria play a significant role in homeostasis. To maintain the proper quality and quantity of mitochondria requires both mitochondrial degradation and division. A selective type of autophagy, mitophagy, drives the degradation of excess or damaged mitochondria, whereas division is controlled by a specific fission complex; however, the relationship between these two processes, especially the role of mitochondrial fission during mitophagy, remains unclear. In this study, we report that mitochondrial fission is important for the progression of mitophagy. When mitophagy is induced, the fission complex is recruited to the degrading mitochondria through an interaction between Atg11 and Dnm1; interfering with this interaction severely blocks mitophagy. These data establish a paradigm for selective organelle degradation.


Figures

Figure 1
Figure 1. Mitochondrial Fission Is Required for Mitophagy
MitoPho8Δ60 activity is reduced in strains with deletions of genes encoding mitochondrial fission proteins. Wild-type (KWY20), atg32Δ (KWY22), dnm1Δ (KDM1013), fis1Δ (KDM1002), mdv1Δ (KDM1006), caf4Δ (KDM1011), mdv1Δ caf4Δ (KDM1012) and whi2Δ (KDM1010) cells in the mitoPho8Δ60 background were cultured in YPL to mid-log phase, then shifted to SD-N for 6 h. The mitoPho8Δ60 assay was performed as described in Experimental Procedures. Error bars correspond to the standard error, and were obtained from three independent repeats. * p<0.01; ** p<0.001; *** p<0.0001.
Figure 2
Figure 2. BiFC 32-11 Dots Mark Degrading Mitochondria During Mitophagy
(A) A BiFC assay was performed for Atg32, Atg1 1, Om45 and Atg9. Cells containing BiFC pairs (Atg32-Atg1 1 in KDM1501, Atg32-Atg9 in KDM1519 and Atg11-Om45 in KDM1520) were cultured in YPL and shifted to SD-N for 1 h, followed by analysis by fluorescence microscopy; images are representative pictures from single Z-sections. DIC, differential interference contrast. Scale bar, 2 µm. (B) Quantification of (A). 12 Z-section images were projected and the percentage of cells that contained 32-11 dots was determined. Standard error was calculated from three independent experiment. * p<0.01. (C) VN-ATG32 VC-ATG11 (KDM1501) cells, transformed with pMito-RFP, were cultured in SML and shifted to SD-N from 10 min to 1 h, and the cell samples were observed by fluorescence microscopy. CellTracker Blue CMAC was used to stain the vacuolar lumen. Arrowheads indicate the 32-11 dots that localized on the mitochondrial reticulum; and arrows indicate the 32-11 dots that localized on the vacuolar periphery. All of the images are representative pictures from single Z-sections. DIC, differential interference contrast. Scale bar, 2 µm. The inset in row 5, panel 4 corresponds to the large vacuole, reducing the red intensity to demonstrate that the intravacuolar punctum corresponds to a green 32-11 dot that has not yet been degraded. Also see Fig. S1.
Figure 3
Figure 3. Atg11 Recruits Dnm1 to the Degrading Mitochondria
(A) VN-ATG32 VC-ATG11 DNM1-mCherry cells, transformed with pMito-BFP, were cultured in SML and shifted to SD-N for 1 h, and samples were observed by fluorescence microscopy. Arrowheads indicate the colocalized 32-11 dots with Dnm1-mCherry on the mitochondrial reticulum. All of the images are representative pictures from single Z-sections. DIC, differential interference contrast. Scale bar, 2 µm. (B) VC-ATG11 DNM1-VN cells transformed with empty vector or pDnm1-3HA, VC-ATG11 cells transformed with pDnm1-VN, and VN-ATG11 VC-FIS1 cells transformed with empty vector were cultured in SML and shifted to SD-N for 1 h. Samples were observed by fluorescence microscopy as in (A). Scale bar, 2 µm. (C) VC-ATG11 DNM1-mCherry cells, transformed with pDnm1-VN, were cultured in SML and shifted to SD-N for 30 min. Samples were observed by fluorescence microscopy as in (A). Scale bar, 2 µm. Also see Fig. S2.
Figure 4
Figure 4. The ER Participates in Mitophagy-Specific Fission
(A) VN-ATG32 VC-ATG11 (KDM1501) cells, transformed with pMito-BFP and pHDEL-DsRed, were cultured in SML and shifted to SD-N for 30 min. (B, C) VN-ATG32 VC-ATG11 MDM12-mCherry (KDM1561) and VN-ATG32 VC-ATG11 MDM34-mCherry (KDM1562) cells were cultured in YPL and shifted to SD-N for 30 min. The cells in (A, B, and C) were analyzed by fluorescence microscopy. The images are representative pictures from single Z-sections. DIC, differential interference contrast. Scale bars, 2 µm.
Figure 5
Figure 5. Domain Structure of Dnm1 and GED Mutations
The domains of Dnm1 are depicted in the top diagram, and the position of the GED domain (amino acids 670–757) are indicated. The C-terminal truncations, GEDΔ, 24Δ and 30Δ are depicted in the middle diagrams. The sequence of the six amino acid residues comprising E728 through A733 in the GED that are required for the interaction with Atg11 and the mutations 5A and 4R are shown at the bottom.
Figure 6
Figure 6. Mutation of the Dnm1 C Terminus Blocks Mitophagy
(A) Cells containing BiFC pairs (Atg11-Dnm1 in KDM1523, Atg11-Dnm1 (GEDΔ) in KDM1528, Atg11-Dnm1 (24Δ) in KDM1532, and Atg11-Dnm1 (30Δ) in KDM1533) were cultured in YPL and shifted to SD-N for 1 h. Samples were observed by fluorescence microscopy, and all the images are representative pictures from single Z-sections. DIC, differential interference contrast. (B) Quantification of (A). 12 Z-section images were projected and the percentage of cells that contained BiFC Dnm1-Atg11 dots was determined. Standard error was calculated from three independent experiment. * p<0.01. (C) The plasmid pCuHA-Atg11 was transformed into atg11Δ (YTS147), atg11Δ DNM1-PA (KDM1247), atg11Δ DNM1(24Δ)-PA (KDM1248), and atg11Δ DNM1(30Δ) (KDM1249) cells. Cells were cultured in SML and shifted to SD-N for 1.5 h. Cell lysates were prepared and incubated with IgG-Sepharose for affinity isolation as described in Experimental Procedures. The eluted proteins were separated by SDS-PAGE and detected with monoclonal anti-HA antibody and an antibody that binds to PA. (D) VN-ATG11 (KDM1535) cells, transformed with pDnm1-VC, pDnm1(4R)-VC, or pDnm1(5A)-VC, were cultured in SML and shifted to SD-N for 1 h. Samples were observed by fluorescence microscopy as in (A). (E) Quantification of (D). 12 Z-section images were projected and the percentage of cells that contained BiFC Dnm1-Atg11 dots was determined. Standard error was calculated from three independent experiment. * p<0.01. (F) The plasmid pCuHA-Atg11 together with pDnm1-VC, pDnm1(4R)-VC, or pDnm1(5A)-VC were transformed into atg11Δ dnm1Δ (KDM1251) cells. The cells were cultured in SML and shifted to SD-N for 1.5 h. Cell lysates were prepared and analyzed as in (C). Also see Fig. S3.
Figure 7
Figure 7. Dnm1 Mutants that Lose Binding to Atg11 are Mitophagy Defective
(A) The plasmid pCuHA-Atg11 together with pDnm1-PA, pDnm1(E728R)-PA, pDnm1(D729R)-PA, pDnm1(Q730R)-PA, or pDnm1(T731R)-PA was co-transformed into atg11 Δ dnm1 Δ (KDM1251) cells. Cells were cultured in SML and shifted to SD-N for 1.5 h. Cell lysates were prepared and incubated with IgG-Sepharose for affinity isolation as described in Experimental Procedures. The eluted proteins were separated by SDS-PAGE and detected with monoclonal anti-HA antibody and an antibody that binds to PA. (B) MitoPho8Δ60 wild-type (KDM1009) cells were transformed with empty vector; mitoPho8Δ60 dnm1 Δ (KDM1014) cells were transformed with empty vector, pDnm1-PA, pDnm1(E728R)-PA, pDnm1(D729R)-PA, pDnm1(Q730R)-PA, or pDnm1(T731R)-PA. Cells were cultured in SML to mid-log phase, then shifted to SD-N for 6 h. The mitoPho8Δ60 assay was performed as described in Experimental Procedures. Error bars correspond to the standard error, and were obtained from three independent repeats. * p<0.01. Also see Fig. S4.

Comment in

References

    1. Aoki Y, Kanki T, Hirota Y, Kurihara Y, Saigusa T, Uchiumi T, Kang D. Phosphorylation of Serine 114 on Atg32 mediates mitophagy. Mol. Biol. Cell. 2011;22:3206–3217. - PMC - PubMed
    1. Baba M, Osumi M, Scott SV, Klionsky DJ, Ohsumi Y. Two distinct pathways for targeting proteins from the cytoplasm to the vacuole/lysosome. J. Cell Biol. 1997;139:1687–1695. - PMC - PubMed
    1. Bleazard W, McCaffery JM, King EJ, Bale S, Mozdy A, Tieu Q, Nunnari J, Shaw JM. The dynamin-related GTPase Dnm1 regulates mitochondrial fission in yeast. Nat. Cell Biol. 1999;1:298–304. - PMC - PubMed
    1. Farre JC, Manjithaya R, Mathewson RD, Subramani S. PpAtg30 tags peroxisomes for turnover by selective autophagy. Dev. cell. 2008;14:365–376. - PMC - PubMed
    1. Friedman JR, Lackner LL, West M, DiBenedetto JR, Nunnari J, Voeltz GK. ER tubules mark sites of mitochondrial division. Science. 2011;334:358–362. - PMC - PubMed

Publication types

MeSH terms

Substances