. 2013 Oct;23(10):1601-14.
doi: 10.1101/gr.157271.113. Epub 2013 Jun 28.

De novo DNA demethylation and noncoding transcription define active intergenic regulatory elements

Affiliations

De novo DNA demethylation and noncoding transcription define active intergenic regulatory elements

Felix Schlesinger et al. Genome Res. 2013 Oct.

Abstract

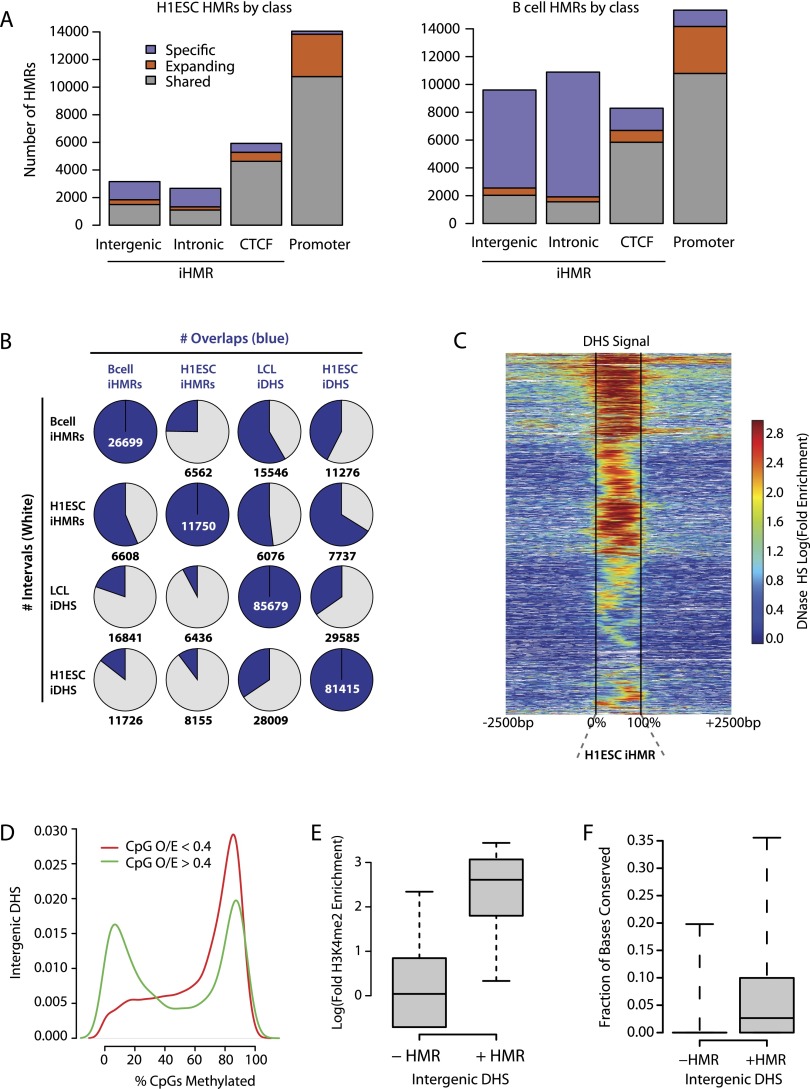
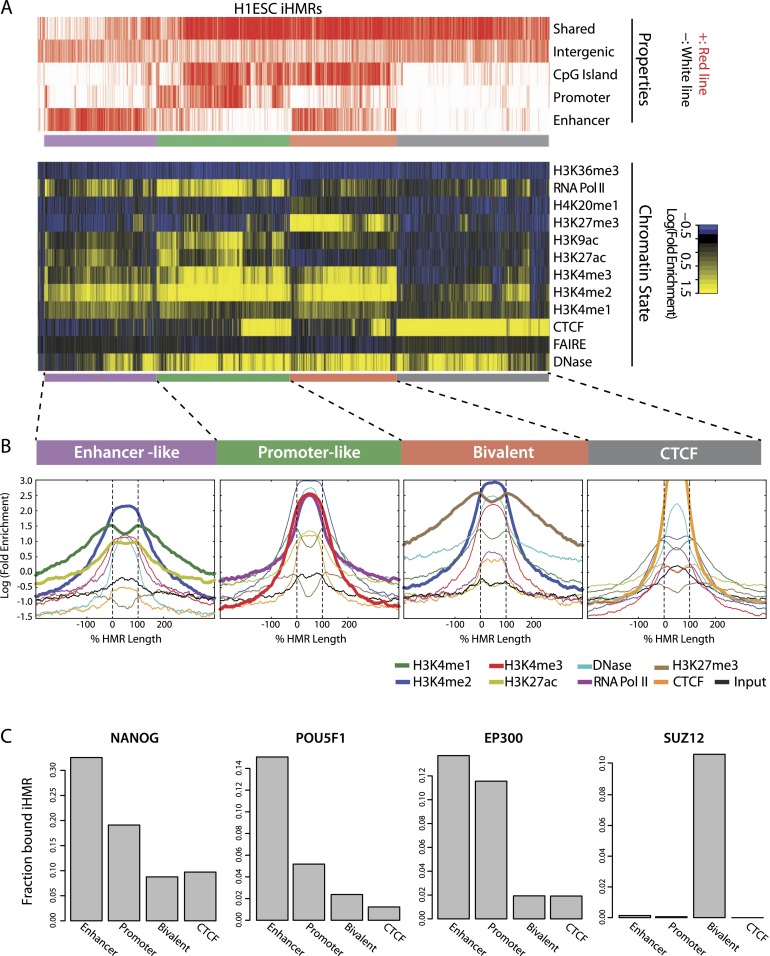
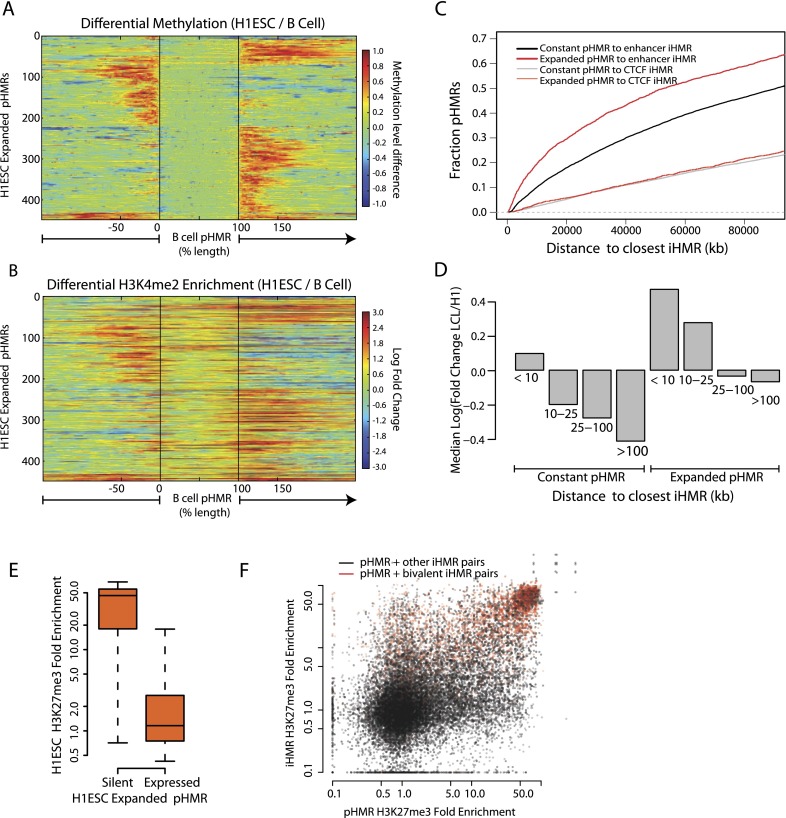
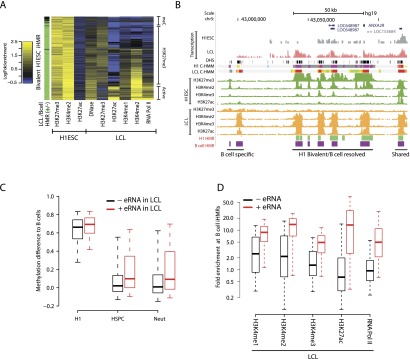
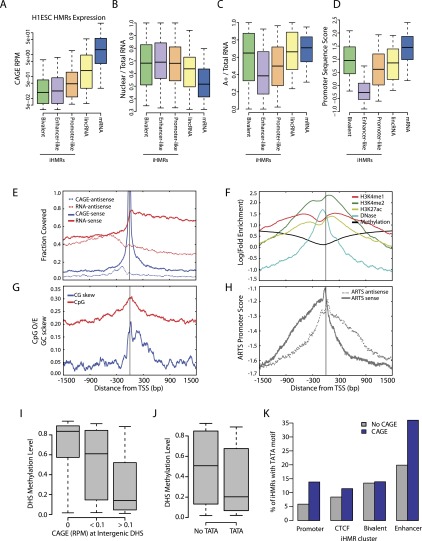
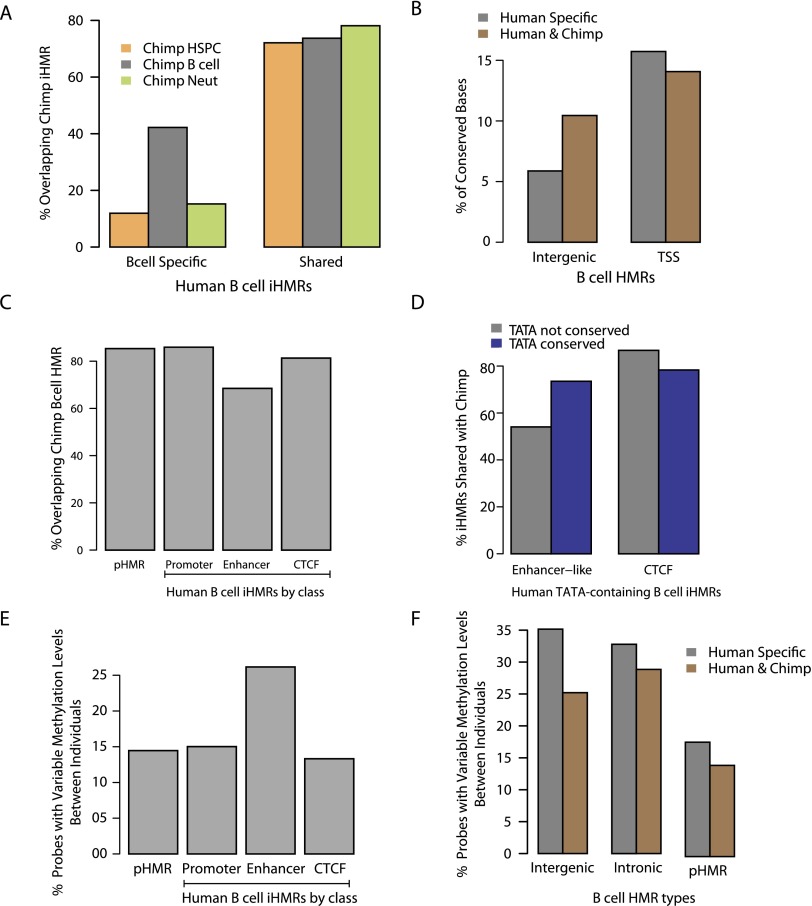
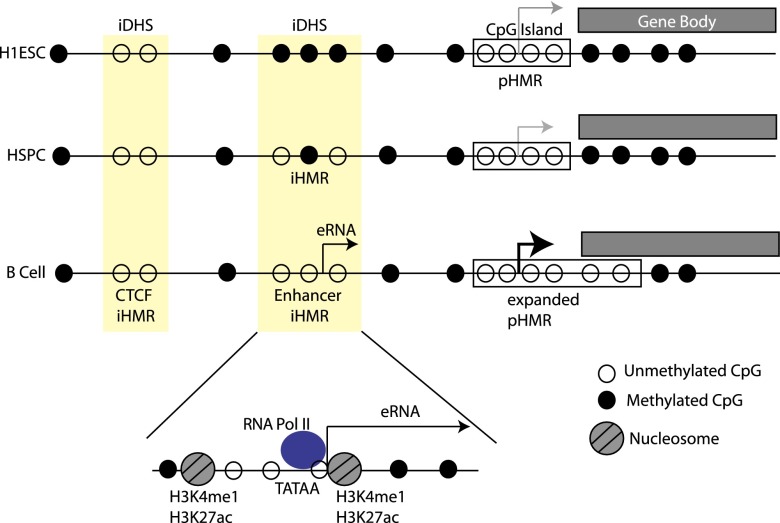
Deep sequencing of mammalian DNA methylomes has uncovered a previously unpredicted number of discrete hypomethylated regions in intergenic space (iHMRs). Here, we combined whole-genome bisulfite sequencing data with extensive gene expression and chromatin-state data to define functional classes of iHMRs, and to reconstruct the dynamics of their establishment in a developmental setting. Comparing HMR profiles in embryonic stem and primary blood cells, we show that iHMRs mark an exclusive subset of active DNase hypersensitive sites (DHS), and that both developmentally constitutive and cell-type-specific iHMRs display chromatin states typical of distinct regulatory elements. We also observe that iHMR changes are more predictive of nearby gene activity than the promoter HMR itself, and that expression of noncoding RNAs within the iHMR accompanies full activation and complete demethylation of mature B cell enhancers. Conserved sequence features corresponding to iHMR transcript start sites, including a discernible TATA motif, suggest a conserved, functional role for transcription in these regions. Similarly, we explored both primate-specific and human population variation at iHMRs, finding that while enhancer iHMRs are more variable in sequence and methylation status than any other functional class, conservation of the TATA box is highly predictive of iHMR maintenance, reflecting the impact of sequence plasticity and transcriptional signals on iHMR establishment. Overall, our analysis allowed us to construct a three-step timeline in which (1) intergenic DHS are pre-established in the stem cell, (2) partial demethylation of blood-specific intergenic DHSs occurs in blood progenitors, and (3) complete iHMR formation and transcription coincide with enhancer activation in lymphoid-specified cells.


Figures

Figure 1.
Figure 1.
Distribution of hypomethylated regions in stem and differentiated cells. (A) Genomic distribution of hypomethylated regions (HMR) in H1 ESCs and B cells. Colors in each bar indicate whether an HMR is shared between the two cell types, specific to one, or shared but expanding, i.e., significantly larger in one cell type than in the other. (B) Overlap between iHMRs and DHS in the different cell-types. (C) Most iHMRs contain regions of DNase hypersensitivity. The heatmap shows the enrichment of DNase-seq signal at H1 ESC iHMRs. iHMRs are aligned between the black lines, white points indicate genomic locations not mappable with short DNase-seq reads. Rows are sorted by hierarchical clustering. (D) A subset of high CpG density DNase HS is hypomethylated. Distribution of average methylation levels for DHS in H1 ESC split by CpG density (observed/expected; O/E). (E) Hypomethylated DHS are marked by histone modifications. Log fold enrichment over genomic background for H3K4me2 at intergenic H1 ESC DHS with high (>0.4 O/E) CpG density is shown. (F) Hypomethylated DHS have higher sequence conservation. The fraction of positions with phastCons scores over 0.9 in intergenic DHS depending on methylation state is shown.
Figure 2.
Figure 2.
Hypomethylated regions mark different classes of active genomic regulatory elements. (A) Diverse chromatin states at H1 iHMRs. Heatmap showing the chromatin state within iHMRs. Each column represents one iHMR, sorted by hierarchical clustering, grouped into four main clusters. The top lines indicate overlap of the HMR with functional element predictions from ENCODE, CpG Islands, the iHMR location (intergenic or intronic), and whether it is shared between H1 ESCs and B cells. (B) Average chromatin mark profile in H1 ESC iHMRs of the four different clusters defined in A. HMRs are aligned between the black lines, and the fold-enrichment signals are averaged across all iHMRs at each relative position. Bold lines highlight the histone marks that distinguish each cluster. (C) Barplots show, for each of the defined classes, the fraction of iHMRs occupied by factors associated with different types of elements and chromatin states.
Figure 3.
Figure 3.
Coordinated changes in pHMRs, iHMRs, and histone marks occur at cell-type specifically regulated genes. (A) Differential hypomethylation at expanding promoter HMRs. B cell pHMRs are aligned between the black lines and color denotes the change in methylation level between H1 ESCs and B cells at each position. (B) As above, differential H3K4me2 ChIP-seq signal in H1 ESCs is displayed for the same sites. Color denotes the fold change in H3K4me2 enrichment between H1 ESCs and LCLs. (C) Enhancer HMRs are enriched near expanding promoter HMRs. Cumulative density plot showing the distances between expanded or constant pHMRs and enhancer or CTCF iHMRs. (D) Genes with both expanding pHMRs and nearby cell-type-specific iHMRs are up-regulated. Median fold expression change (CAGE signal) between LCLs and H1 ESCs for genes grouped by the distance to the closest B cell–specific iHMR and by significant expansion of their promoter HMR. (E) A subset of expanded promoter HMRs are silenced and marked with H3K27me3 in stem cells. Genes with an H1 ESC-specific expanded promoter HMR are split by their expression levels (at 1 CAGE RPM), and fold enrichment for H3K27me3 at the promoter in H1 ESCs is shown. (F) Bivalent promoters have nearby bivalently marked iHMRs. Scatterplot with H3K27me3 signal at pairs of pHMRs and nearby (<25 kb) iHMRs.
Figure 4.
Figure 4.
Resolution of bivalent iHMRs during differentiation and stepwise, de novo hypomethylation at transcribed enhancer-like iHMRs. (A) Bivalent iHMRs are resolved to active or silenced chromatin states during differentiation. Heatmap showing the LCL chromatin profile at iHMRs with a bivalent chromatin signature in H1 ESCs. Sidebar colors indicate whether the HMR remains hypomethylated in B cells (green) or becomes fully methylated (black). (B) Example locus surrounding ANXA2R, a gene expressed in lymphocytes and bone marrow, illustrating the coordinated resolution of the H1 ESC bivalent chromatin state in B cells/LCL. ENCODE regulation and transcription tracks are shown along with chromatin states modeled by ChromHMM (Ernst et al. 2011) in H1ES and GM12878 cells. Transcription tracks are presented in log scale. (C) Transcribed, active enhancer-like iHMRs in B cells are fully methylated in H1 ESCs and show intermediate states in other blood cell types. Differences in methylation levels between other cell types and B cell iHMRs are shown. (D) Only B cell iHMRs with eRNA (>0.1 RPKM) show strong enrichment for chromatin marks, suggesting an active regulatory state.
Figure 5.
Figure 5.
iHMRs produce different classes of transcripts from specific transcription start sites. (AD) Different types of RNAs arise from iHMRs classes. Boxplots represent the distribution of values (fifth to 95th percentile) for each iHMR class compared with annotated lincRNAs and mRNAs. Enhancer iHMR transcripts are less expressed and less polyadenylated, while bivalent HMRs make low abundance poly(A) RNAs. Promoter-like, but not enhancer-like iHMRs contain strong promoter sequence signals. (A) Expression level, (B) nuclear localization, (C) polyadenylation levels, (D) genomic sequence-based promoter prediction scores (ARTS). (E–H) eRNA TSS positions match specific sequence and chromatin features. (E) Fraction of positions covered with RNA-seq (transcript body) and CAGE tags (TSS). (F) Specific positional arrangement of histone modifications and DNase hypersensitivity around the eRNA TSS. (G) CpG density is symmetric around the TSS, but GC-skew (strand bias of “G” vs. “C”) occurs specifically in the direction of transcription. (H) ARTS genomic sequence-based TSS prediction scores peak at the experimentally defined eRNA TSS in the sense direction. (I) Transcription is linked with hypomethylation at intergenic DHSs. Methylation levels at DHS with or without transcription are shown. (J) Presence of the TATA motif at DHS is linked with hypomethylation. Methylation levels at DHS with and without an exact TATA motif match are shown. (K) The TATA motif predicts transcription of enhancer-like iHMRs. The barplot depicts the fraction of expressed (CAGE RPM >0.1) and silent iHMRs in different clusters that contain an exact TATAAA match.
Figure 6.
Figure 6.
iHMRs are conserved in methylation state and sequence, and are enriched for human population variation in methylation levels. (A) Cell-type-specific hypomethylation is conserved between human and chimp. Overlap between human B cell–specific or shared HMRs with HMRs in different chimpanzee cell types. (B) Intergenic HMRs shared between human and chimp are also more conserved at the sequence level. (C) Enhancer-like iHMRs are more variable between human and chimp. Barplots show the percentage of B cell iHMRs of different classes that overlap a chimp B cell iHMR. (D) Conservation of the TATA motif at enhancer-like iHMRs predicts conservation of hypomethylation. Barplots show the percentage of human iHMRs (containing the TATA motif) shared with chimp for (left) transcribed, enhancer-like iHMRs and (right) CTCF iHMRs, depending on whether the TATA motif is conserved in chimp. (E) Methylation is more variable at enhancer-like iHMRs in the human population. Barplots show the fraction of probed loci in different HMR classes at which methylation levels vary significantly between whole-blood samples from individuals (see Methods). (F) iHMRs that are conserved with chimp are also less variable in methylation level between human individuals.
Figure 7.
Figure 7.
Model of iHMR behavior at a B cell specifically expressed gene. Shared DHS sites are pre-established in the embryonic stem cell. Hypomethylation at the CpG Island gene promoter (right) and at a CTCF iHMR (left) is constant during development. The enhancer-like iHMR (middle) is fully methylated in H1 ESC. In blood-specified progenitors (HSPCs), it becomes partially demethylated but remains inactive, i.e., lacks H3K4 methylation and RNA transcription. In the B cell state, where the gene is expressed, the promoter HMR expands beyond the core CGI region, and the iHMR becomes fully hypomethylated. The enhancer-like iHMR displays an active enhancer chromatin state (H3K4me1, H3K27ac). It is bound by TBP and RNA Pol II at specific sequence elements (including the TATA box), which initiate eRNA transcription within the iHMR.

References

    1. Akhtar-Zaidi B, Cowper-Sal Lari R, Corradin O, Saiakhova A, Bartels CF, Balasubramanian D, Myeroff L, Lutterbaugh J, Jarrar A, Kalady MF, et al. 2012. Epigenomic enhancer profiling defines a signature of colon cancer. Science 336: 736–739 - PMC - PubMed
    1. Arnosti DN, Kulkarni MM 2005. Transcriptional enhancers: Intelligent enhanceosomes or flexible billboards? J Cell Biochem 94: 890–898 - PubMed
    1. Bock C, Beerman I, Lien WH, Smith ZD, Gu H, Boyle P, Gnirke A, Fuchs E, Rossi DJ, Meissner A 2012. DNA methylation dynamics during in vivo differentiation of blood and skin stem cells. Mol Cell 47: 633–647 - PMC - PubMed
    1. Bulger M, Groudine M 2011. Functional and mechanistic diversity of distal transcription enhancers. Cell 144: 327–339 - PMC - PubMed
    1. Creyghton MP, Cheng AW, Welstead GG, Kooistra T, Carey BW, Steine EJ, Hanna J, Lodato MA, Frampton GM, Sharp P, et al. 2010. Histone h3k27ac separates active from poised enhancers and predicts developmental state. Proc Natl Acad Sci 107: 21931–21936 - PMC - PubMed

Publication types

MeSH terms

Associated data

LinkOut - more resources