. 2013 Sep 17:248:541-51.
doi: 10.1016/j.neuroscience.2013.06.031. Epub 2013 Jun 27.

Theoretical principles underlying optical stimulation of myelinated axons expressing channelrhodopsin-2

Affiliations

Theoretical principles underlying optical stimulation of myelinated axons expressing channelrhodopsin-2

R L Arlow et al. Neuroscience. .

Abstract

Numerous clinical conditions can be treated by neuromodulation of the peripheral nervous system (PNS). Typical electrical PNS therapies activate large diameter axons at lower electrical stimulus thresholds than small diameter axons. However, recent animal experiments with peripheral optogenetic neural stimulation (PONS) of myelinated axons expressing channelrhodopsin-2 (ChR2) have shown that this technique activates small diameter axons at lower irradiances than large diameter axons. We hypothesized that the small-to-large diameter recruitment order primarily arises from the internodal spacing relationship of myelinated axons. Small diameter axons have shorter distances between their nodes of Ranvier, which increases the number of nodes of Ranvier directly illuminated relative to larger diameter axons. We constructed "light-axon" PONS models that included multi-compartment, double cable, myelinated axon models embedded with ChR2 membrane dynamics, coupled with a model of blue light dynamics in the tissue medium from a range of different light sources. The light-axon models enabled direct calculation of threshold irradiance for different diameter axons. Our simulations demonstrate that illumination of multiple nodal sections reduces the threshold irradiance and enhances the small-to-large diameter recruitment order. In addition to addressing biophysical questions, our light-axon model system could also be useful in guiding the engineering design of optical stimulation technology that could maximize the efficiency and selectivity of PONS.

Keywords: ChR2; action potential; node of Ranvier; optogenetic.


Conflict of interest statement

CONFLICT OF INTEREST

The authors declare no competing financial interests related to this work.

Figures

Fig. 1
Fig. 1
Light-axon model. (A–C) Light density distribution models. Three dimensional and cross-sectional planes are presented for (A) single fiber optic, (B) single LED, and (C) 16 LED cuff. The single LED and single fiber optic 3D representations have been sliced in half to visualize the light distribution. (D) Four-state model of ChR2 in which incident light energy (hv) results in an increase in the Ka1 and Ka2 rate constants and subsequent increase in probability of the O1 and O2 channel states, leading to ChR2 current. (E) MRG axon model with ChR2. Above: diagram of the various nodal and internodal segments. Below: circuit diagram including additions of ChR2 channels in the axon membrane.
Fig. 2
Fig. 2
Action potential initiation. (A) Traces of transmembrane voltage, (B) transmembrane ChR2 current, and (C) ChR2 channel conductance in response to a 0.5-ms blue light pulse (as denoted by the gray bar and vertical dotted gray line) from the single fiber optic light density distribution model. The following parameters were used: axon diameter=5.7 μm, source-to-axon distance=530 μm, and the central axon node was directly under the center of the light source.
Fig. 3
Fig. 3
Activating functions. Activating function values evaluated for individual nodes of Ranvier at the threshold for action potential initiation for a small or a large diameter axon: (A) 16 LED cuff (CUFF), (B) single LED, (C) single fiber optic light density distribution models, and (D) cathodic electrical point source electrode. Source-to-axon distance=530 μm and pulse duration=0.5 ms. The central axon node (i.e. node 10) was directly under the center of the light source for all simulations.
Fig. 4
Fig. 4
Strength–duration relationships. Threshold irradiance as a function of pulse duration for various axon diameters. (A) 16 LED cuff (CUFF), (B) single LED, and (C) single fiber optic light density distribution models. Irradiance is reported as the value immediately exiting the light source. (D) Threshold current for extracellular electrical stimulation of the same axon models. The following parameters were used: source-to-axon distance=530 μm, and the central axon node was directly under the center of the light source.
Fig. 5
Fig. 5
Intensity–distance relationships. Threshold irradiance as a function of source-to-axon distances. (A) 16 LED cuff (CUFF), (B) single LED, and (C) single fiber optic light density distribution models. Irradiance is reported as the value immediately exiting the light source tip. Note different y-axis scale for 16 LED cuff. (D) Threshold current for extracellular electrical stimulation of the same axon models. The following parameters were used: pulse duration= 0.5 ms, and the central axon node was directly under the center of the light source.
Fig. 6
Fig. 6
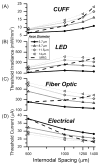
Relative contribution of internodal spacing. Threshold irradiance as a function of internodal spacing for various axon diameters. (A) 16 LED cuff (CUFF), (B) single LED, and (C) single fiber optic light density distribution models. Irradiance is reported as the value immediately exiting the light source. (D) Threshold current for extracellular electrical stimulation of the same axon models. The dotted line corresponds to the threshold stimulus of the axons with default internodal spacing parameter values. The following parameters were used: source-to-axon distance=530 μm, pulse duration= 0.5 ms, and the central axon node was directly under the center of the light source.
Fig. 7
Fig. 7
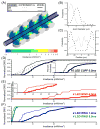
Population model. (A) PONS model visualization. The lateral gastrocnemius axon sub-population (LG) is typically of larger diameter, located closer toward the periphery, and is represented with a thicker line as compared with the soleus axon sub-population (SOL). The probability density function for the SOL (small dotted line) and LG (large dotted line) is shown at varying (B) axon diameters and (C) source-to-axon distances. Position=0 μm corresponds to the center of the sciatic nerve and ±180 μm corresponds to the sciatic nerve boundaries. Probability data are reproduced from Llewellyn et al. (2010). (D, E) Simulated normalized EMG of the SOL (solid thin line) and LG (solid thick line) across varying irradiances. (D) Simulated results from the 16 LED optical cuff model with 0.5-ms pulse duration compared to the experimental results for the normalized EMG of the SOL (dotted smaller line) and LG (dotted larger line) reproduced from Llewellyn et al. (2010). The inset graph displays the percentage of axons activated as a function of the light intensity. (E) Simulated results from the 4 LED ring model with 0.5-ms pulse duration (Red) plotted on the same irradiance scale as D. Inset shows recruitment at higher irradiances. (F) Simulated results from the 4 LED ring model with 1-ms pulse duration (Blue) and with 5-ms pulse duration (Green) plotted on the same irradiance scale as D. (For interpretation of the references to color in this figure legend, the reader is referred to the web version of this article.)

References

    1. Aravanis AM, Wang LP, Zhang F, Meltzer LA, Mogri MZ, Schneider MB, Deisseroth K. An optical neural interface: in vivo control of rodent motor cortex with integrated fiberoptic and optogenetic technology. J Neural Eng. 2007;4:S143–S156. - PubMed
    1. Deisseroth K. Optogenetics. Nat Meth. 2011;8:26–29. - PMC - PubMed
    1. Foutz TJ, Arlow RL, McIntyre CC. Theoretical principles underlying optical stimulation of a channelrhodopsin-2 positive pyramidal neuron. J Neurophysiol. 2012;107:3235–3245. - PMC - PubMed
    1. Gradinaru V, Mogri M, Thompson KR, Henderson JM, Deisseroth K. Optical deconstruction of parkinsonian neural circuitry. Science. 2009;17(324):354–359. - PMC - PubMed
    1. Grossman N, Nikolic K, Toumazou C, Degenaar P. Modeling study of the light stimulation of a neuron cell with channelrhodopsin-2 mutants. IEEE Trans Biomed Eng. 2011;58:1742–1751. - PubMed

Publication types