. 2013 Sep 17:248:602-19.
doi: 10.1016/j.neuroscience.2013.06.029. Epub 2013 Jun 27.

Status epilepticus triggers early and late alterations in brain-derived neurotrophic factor and NMDA glutamate receptor Grin2b DNA methylation levels in the hippocampus

Affiliations

Status epilepticus triggers early and late alterations in brain-derived neurotrophic factor and NMDA glutamate receptor Grin2b DNA methylation levels in the hippocampus

R Ryley Parrish et al. Neuroscience. .

Abstract

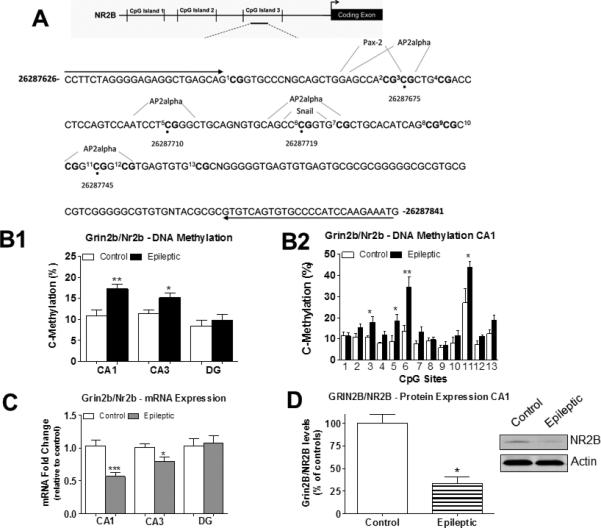
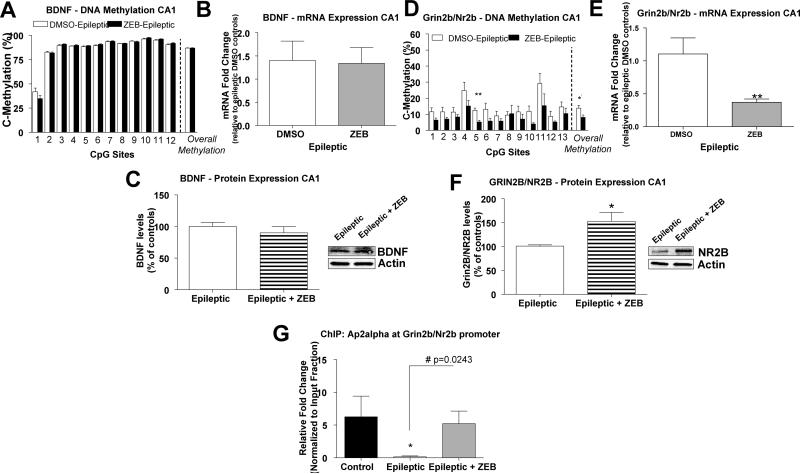
Status epilepticus (SE) triggers abnormal expression of genes in the hippocampus, such as glutamate receptor subunit epsilon-2 (Grin2b/Nr2b) and brain-derived neurotrophic factor (Bdnf), that is thought to occur in temporal lobe epilepsy (TLE). We examined the underlying DNA methylation mechanisms and investigated whether these mechanisms contribute to the expression of these gene targets in the epileptic hippocampus. Experimental TLE was provoked by kainic acid-induced SE. Bisulfite sequencing analysis revealed increased Grin2b/Nr2b and decreased Bdnf DNA methylation levels that corresponded to decreased Grin2b/Nr2b and increased Bdnf mRNA and protein expression in the epileptic hippocampus. Blockade of DNA methyltransferase (DNMT) activity with zebularine decreased global DNA methylation levels and reduced Grin2b/Nr2b, but not Bdnf, DNA methylation levels. Interestingly, we found that DNMT blockade further decreased Grin2b/Nr2b mRNA expression whereas GRIN2B protein expression increased in the epileptic hippocampus, suggesting that a posttranscriptional mechanism may be involved. Using chromatin immunoprecipitation analysis we found that DNMT inhibition restored the decreases in AP2alpha transcription factor levels at the Grin2b/Nr2b promoter in the epileptic hippocampus. DNMT inhibition increased field excitatory postsynaptic potential in hippocampal slices isolated from epileptic rats. Electroencephalography (EEG) monitoring confirmed that DNMT inhibition did not significantly alter the disease course, but promoted the latency to seizure onset or SE. Thus, DNA methylation may be an early event triggered by SE that persists late into the epileptic hippocampus to contribute to gene expression changes in TLE.

Keywords: Bdnf; DNA demethylation; Grin2b/Nr2b; epigenetics; epilepsy; seizures.


Figures

Figure 1
Figure 1
KA-induced SE triggers changes in global hippocampal DNA methylation levels and expression of genes encoding for DNMT and TET methylating enzymes. A) Diagram of experimental setup and an illustration of the method for sub-dissection of hippocampal regions using the fissure markings of the hippocampus. Dotted lines indicate cuts made to dissect hippocampal regions: CA1, CA3, and the DG region. B) 5-mC DNA methylation levels remained unchanged in all hippocampal regions assessed during SE but were significantly increased later in areas CA1 and CA3 of the hippocampus from epileptic animals compared to controls. However, in the DG region of the hippocampus, 5-mC DNA methylation levels were significantly decreased following epilepsy onset (CA1 SE, t(13) = 0.68, p = 0.51, n = 7-8; CA1 epileptic, t(14) = 2.34, p = 0.03, n = 8; CA3 SE, t(13) = 1.17, p = 0.26, n = 7-8; CA3 epileptic, t(16) = 2.12, p = 0.05, n = 9; DG SE, t(13) = 0.94, p = 0.36, n = 7-8; DG epileptic, t(11) = 3.65, p = 0.003, n = 6-7). C) 5-hmC DNA methylation levels were not significantly altered in area CA1 of the hippocampus during SE or following the onset of epilepsy. 5-hmC DNA methylation levels were significantly decreased in hippocampal area CA3 during SE and later returned to baseline levels in the hippocampus of epileptic rats compared to controls. 5-hmC DNA methylation levels were unchanged in the DG region during SE but were significantly decreased in the DG region of the epileptic hippocampus relative to controls (CA1 SE, t(9) = 0.28, p = 0.78, n = 4-7; CA1 epileptic, t(10) = 0.01, p = 0.99, n = 5-7; CA3 SE, t(11) = 3.90, p = 0.003, n = 6-7; CA3 epileptic, t(9) = 0.93, p = 0.37, n = 5-6; DG SE, t(12) = 0.20, p = 0.84, n = 6-8; DG epileptic, t(10) = 3.15, p = 0.01, n = 5-7). D) DNMT1 mRNA levels were not significantly altered in hippocampal area CA1 during SE or in the epileptic hippocampus compared to controls. DNMT1 mRNA levels were significantly decreased in hippocampal area CA3 during SE, while no changes were observed in area CA3 of the epileptic hippocampus compared to controls. DNMT1 mRNA levels were significantly decreased in the DG region during SE, while no change occurred in the DG region of the epileptic hippocampus relative to controls (CA1 SE, t(13) = 0.92, p = 0.37, n = 7-8; CA1 epileptic, t(11) = 0.10, p = 0.93, n = 6-7; CA3 SE, t(13) = 2.28, p = 0.04, n = 7-8; CA3 epileptic, t(11) = 1.94, p = 0.08, n = 6-7; DG SE, t(13) = 3.14, p = 0.008, n = 7-8; DG epileptic, t(10) = 0.35, p = 0.73, n = 6). E) DNMT3a mRNA levels were significantly decreased in area CA1 at during SE and at the epileptic stage compared to controls. DNMT3a mRNA levels in area CA3 were unchanged during SE and significantly decreased later in the epileptic hippocampus compared to controls. DNMT3a mRNA levels were unchanged in the DG region during SE and in the epileptic hippocampus relative to controls (CA1 SE, t(13) = 2.40, p = 0.03, n = 7-8; CA1 epileptic, t(15) = 3.248, p = 0.005, n = 8-9; CA3 SE, t(12) = 0.40, p = 0.70, n = 6-8; CA3 epileptic, t(16) = 2.56, p = 0.02, n = 9; DG SE, t(13) = 0.60, p = 0.57, n = 7-8; DG epileptic, t(13) = 0.99, p = 0.34, n = 6-9). F) DNMT3b mRNA levels were unchanged in hippocampal area CA1 during SE and in area CA1 of the epileptic hippocampus compared to controls. DNMT3b mRNA levels were unchanged in area CA3 during SE while being significantly increased in area CA3 of the epileptic hippocampus compared to controls. DNMT3b mRNA levels remained unchanged in the DG region during SE and in the DG region of the epileptic hippocampus relative to controls (CA1 SE, t(13) = 0.80, p = 0.44, n = 7-8; CA1 epileptic, t(15) = 0.62, p = 0.54, n = 8-9; CA3 SE, t(12) = 0.37, p = 0.72, n = 6-8; CA3 epileptic, t(14) = 2.33, p = 0.04, n = 8; DG SE, t(13) = 0.69, p = 0.50, n = 7-8; DG epileptic, t(11) = 0.32, p = 0.76, n = 5-8). G) No changes in TET1 mRNA levels were observed in area CA1 during SE or in the epileptic hippocampus compared to controls. TET1 mRNA levels were significantly decreased in area CA3 and the DG region during SE relative to controls. (CA1 SE, t(13) = 0.14, p = 0.90, n = 7-8; CA1 epileptic, t(10) = 0.56, p = 0.59, n = 6; CA3 SE, t(13) = 2.50, p = 0.03, n = 7-8; CA3 epileptic, t(10) = 0.85, p = 0.42, n = 6; DG SE, t(13) = 3.14, p = 0.008, n = 7-8; DG epileptic, t(10) = 0.49, p = 0.63, n = 6). Student unpaired t-test, *p<0.05, **p<0.01. Error bars are SEM.
Figure 2
Figure 2
Grin2b/Nr2b DNA methylation levels are increased in the epileptic hippocampus and correlate to decreases in mRNA and protein expression. A) Diagram of three CpG Islands found upstream of the Grin2b/Nr2b transcription start site (TSS). Analysis of CpG sites were performed at CpG Island 3 found within the Grin2b/Nr2b gene. A schematic of the regulatory transcription factor binding sites that are important for activity-dependent transcription are shown encompassing CpG sites 3, 5, 6, and 11 within the Grin2b/Nr2b gene. B1) Grin2b/Nr2b DNA methylation levels at these CpG sites were significantly increased in hippocampal areas CA1 and CA3 from epileptic animals compared to controls. No significant change in Grin2b/Nr2b DNA methylation levels were found in the DG region from the epileptic animals relative to controls (CA1, t(5) = 4.29, p = 0.009, n = 6; CA3, t(5) = 2.90, p = 0.03, n = 6; DG, t(5) = 0.31, p = 0.77, n = 6; student paired t-test, *p<0.05, **p<0.01). B2) DNA methylation analysis across 12 CpG sites within the Grin2b/Nr2b gene demonstrates site-specific CpG methylation changes in area CA1 at the epileptic phase (Student paired t-test, *p<0.05, **p<0.01, n=6). C) Grin2b/Nr2b mRNA levels were found to be significantly decreased in hippocampal areas CA1 and CA3 from epileptic animals compared to controls. No significant changes were found in Grin2b/Nr2b mRNA levels in the DG region from epileptic animals relative to controls. (CA1, t(11) = 4.53, p = 0.009, n = 6-7; CA3, t(11) = 2.44, p = 0.03, n = 6; DG, t(11) = 0.28, p = 0.78, n = 6) D) Grin2b/Nr2b protein was significantly decreased in area CA1 of the epileptic animals relative to controls (t(6) = 5.754, p = 0.0022, n = 4) Student unpaired t-test, *p<0.05, **p<0.01, ***p<0.001. Error bars are SEM.
Figure 3
Figure 3
Increased Bdnf mRNA and protein expression in epilepsy correlates to decreased DNA methylation levels in the epileptic hippocampus. A) Diagram of the CpG sites analyzed in the Bdnf coding exon IX. The putative transcription factor binding sites encompassing CpG sites 2 and 4 are shown that are important for activity-dependent gene transcription. B1) Overall Bdnf DNA methylation levels were decreased in hippocampal areas CA1, CA3 and the DG region from epileptic animals. (CA1, t(5) = 3.22, p = 0.02, n = 6; CA3, t(5) = 7.18, p = 0.0008, n = 6; DG, t(5) = 4.79, p = 0.005, n = 6; student paired t-test, *p<0.05, **p<0.01, ***p<0.001). B2) BDNF DNA methylation analysis across 12 CpG sites at the Bdnf gene in area CA1 demonstrates site-specific CpG methylation changes during the epilepsy phase (Student paired t-test, *p<0.05, n=6). C) Bdnf mRNA levels were significantly increased in hippocampal areas CA1, CA3, and DG region from epileptic animals relative to controls (CA1, t(9) = 2.55, p = 0.03, n = 5-6; CA3, t(11) = 2.37, p = 0.04, n = 6-7; DG, t(14) = 2.50, p = 0.03, n = 6) D) BDNF protein was significantly increased in area CA1 of the epileptic animals relative to controls (t(6) = 2.68, p = 0.04, n = 4). Student unpaired t-test, *p<0.05. Error bars are SEM.
Figure 4
Figure 4
Grin2b/Nr2b and Bdnf DNA methylation levels in the hippocampus during kainic acid-induced SE. A1) Grin2b/Nr2b DNA methylation was significantly increased in hippocampal area CA1 of the hippocampus during SE compared to controls. No significant change in Grin2b/Nr2b DNA methylation levels were found in area CA3 and the DG region of the hippocampus during SE relative to controls (CA1, t(6) = 2.47, p = 0.04, n = 7; CA3, t(6) = 0.77, p = 0.47, n = 7; DG, t(6) = 0.57, p = 0.59, n = 7; student paired t-test, *p<0.05). A2) DNA Methylation analysis of 13 CpG dinucleotides at the Grin2b/Nr2b gene show significant increases in specific Grin2b/Nr2b DNA methylation at CpG sites in area CA1 during SE compared to controls (Student unpaired t-test, *p<0.05, **p<0.01, n=7-8). B1) No significant change in Bdnf DNA methylation levels were found in areas CA1 and CA3 and the DG region of the hippocampus during SE relative to control animals (CA1, t(6) = 0.98, p = 0.04, n = 7; CA3, t(6) = 1.77, p = 0.13, n = 7; DG, t(6) = 0.78, p = 0.46, n = 7; student paired t-test, p>0.05). B2) No significant changes were found at the Bdnf CpG sites assessed in area CA1 of the hippocampus during SE compared to controls (Student unpaired t-test, p>0.05, n=7-8). Student unpaired t-test, *p<0.05, **p<0.01. Error bars are SEM.
Figure 5
Figure 5
DNA demethylating enzymes are differentially expressed in the hippocampus following epilepsy onset. A) Gadd45a mRNA levels were significantly increased in hippocampal area CA3 and the DG region from epileptic animals compared to controls. No significant changes were found in area CA1 from epileptic animals compared to controls (CA1, t(15) = 1.32, p = 0.21, n = 8-9; CA3, t(14) = 2.34, p = 0.03, n = 8; DG, t(12) = 4.90, p = 0.0004, n = 6-8). B) Gadd45b mRNA levels were significantly increased in hippocampal area CA1 and the DG region from epileptic animals compared to controls. No significant changes were observed in hippocampal area CA3 from epileptic animals relative to controls (CA1, t(16) = 2.26, p = 0.04, n = 8,9; CA3, t(15) = 0.69, p = 0.50, n = 8; DG, t(15) = 4.38, p = 0.0005, n = 8). C) Apobec1 mRNA levels were significantly increased in hippocampal areas CA1, CA3, and the DG region from epileptic animals relative to controls. (CA1, t(9) = 2. 97, p = 0.02, n = 5,6; CA3, t(11) = 4.64, p = 0.0007, n = 6,7; DG, t(9) = 3.11, p = 0.01, n = 5,6) Student unpaired t-test, *p<0.05, ***p<0.001. Error bars are SEM.
Figure 6
Figure 6
Global DNA methylation levels decrease in the epileptic hippocampus following DNMT inhibition. A) Diagram of the experimental setup. B) DNMT inhibition did not alter global 5-mC DNA methylation levels in hippocampal area CA1 in zebularine-treated control animals compared to DMSO-treated control animals (t(11) = 1.16, p = 0.27, n = 6-7). C) DNMT inhibition significantly decreased global 5-mC DNA methylation levels in hippocampal area CA1 from zebularine-treated epileptic animals relative to DMSO-treated epileptic control animals (t(10) = 3.22, p = 0.009, n = 6). Student unpaired t-test, **p<0.01, n = 6. Error bars are SEM.
Figure 7
Figure 7
Effect of DNMT inhibition on Bdnf and Grin2b/Nr2b DNA methylation, mRNA, and protein expression levels in the epileptic hippocampus. A) Bdnf DNA methylation levels in hippocampal area CA1 from zebularine-treated epileptic animals was not significantly altered compared to Bdnf DNA methylation levels from DMSO-treated epileptic controls (Student paired t-test, p>0.05, n = 6). B) Bdnf mRNA levels in hippocampal area CA1 from zebularine-treated epileptic animals was not significantly altered compared to DMSO-treated epileptic controls (t(9) = 0.91, p = 0.11, n = 6; student unpaired t-test). C) DNMT inhibition did not significantly alter BDNF protein expression in hippocampal area CA1 of zebularine-treated epileptic animals compared to DMSO-treated epileptic control. (t(5) = 0.89, p = 0.41, n = 3-4; Student unpaired t-test). D) DNMT inhibition significantly decreased Grin2b/Nr2b promoter DNA methylation levels in hippocampal area CA1 from zebularine-treated epileptic animals relative to DMSO-treated epileptic control animals (Student paired t-test, *p<0.05, n = 6). E) DNMT inhibition significantly decreased Grin2b/Nr2b mRNA expression levels in hippocampal area CA1 from zebularine-treated epileptic animals relative to DMSO-treated epileptic controls (t(9) = 3.26, p = 0.009, n = 6-7; student unpaired t-test, **p<0.01). F) DNMT inhibition significantly increased GRIN2B/NR2B protein expression in area CA1 of zebularine-treated epileptic animals relative to DMSO-treated epileptic control. (t(6) = 2.76, p = 0.03, n=4; Student unpaired t-test, *p<0.05). G) ChIP analysis revealed that Ap2alpha binding at the Grin2b/Nr2b promoter was significantly decreased in the DMSO-treated epileptic animals compared to DMSO-treated non-epileptic controls and compared to zebularine-treated epileptic animals (#,*p<0.05, n=4). Error bars are SEM.
Figure 8
Figure 8
DNMT inhibition enhances excitability in the hippocampus and alters seizure onset, but not epilepsy outcome following SE. A) Diagram of the experimental setup. B) DNMT inhibition significantly increased fEPSP slope in CA1 dendrites after epilepsy onset (ANOVA, p<0.05 n=8-16). C) fEPSP slope plotted against fiber volley amplitude. Straight lines were plotted to each data set using linear regression. The zebularine-treated epileptic group showed a significantly steeper slope compared to the DMSO-treated epileptic control group (ANOVA, p<0.05 n=8-16). D) Example traces from DMSO-treated epileptic control (right) and zebularine-treated epileptic (left) hippocampal slices. E) DNMT inhibition significantly decreased latency to forelimb clonus following KA administration. (t(14) = 2.54, p = 0.02, n = 8). Student unpaired t-test, *p<0.05. F) EEG monitoring of epileptic animals revealed that DNMT inhibition did not alter the average number of interictal spikes or the number of seizures following SE (n = 2-3). Error bars are SEM.

References

    1. Amir RE, Van den Veyver IB, Wan M, Tran CQ, Francke U, Zoghbi HY. Rett syndrome is caused by mutations in X-linked MECP2, encoding methyl-CpG-binding protein 2. Nat Genet. 1999;23:185–188. - PubMed
    1. Auzmendi J, Gonzalez N, Girardi E. The NMDAR subunit NR2B expression is modified in hippocampus after repetitive seizures. Neurochem Res. 2009;34:819–826. - PubMed
    1. Bandyopadhyay S, Hablitz JJ. NR2B antagonists restrict spatiotemporal spread of activity in a rat model of cortical dysplasia. Epilepsy Res. 2006;72:127–139. - PubMed
    1. Barreto G, Schafer A, Marhold J, Stach D, Swaminathan SK, Handa V, Doderlein G, Maltry N, Wu W, Lyko F, Niehrs C. Gadd45a promotes epigenetic gene activation by repair-mediated DNA demethylation. Nature. 2007;445:671–675. - PubMed
    1. Binder DK. The role of BDNF in epilepsy and other diseases of the mature nervous system. Advances in experimental medicine and biology. 2004;548:34–56. - PubMed

Publication types

MeSH terms