. 2013 Dec;20(12):1631-43.
doi: 10.1038/cdd.2013.77. Epub 2013 Jun 28.

Identification of PTEN at the ER and MAMs and its regulation of Ca(2+) signaling and apoptosis in a protein phosphatase-dependent manner

Affiliations

Identification of PTEN at the ER and MAMs and its regulation of Ca(2+) signaling and apoptosis in a protein phosphatase-dependent manner

A Bononi et al. Cell Death Differ. 2013 Dec.

Abstract

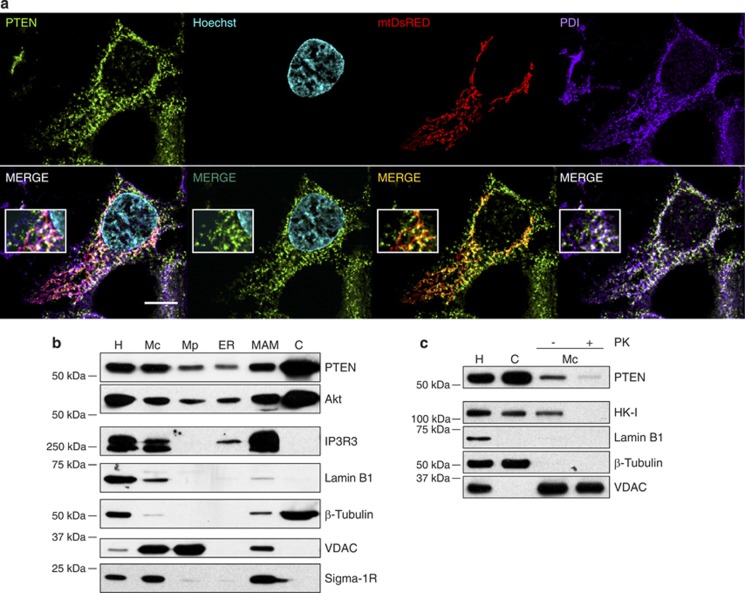
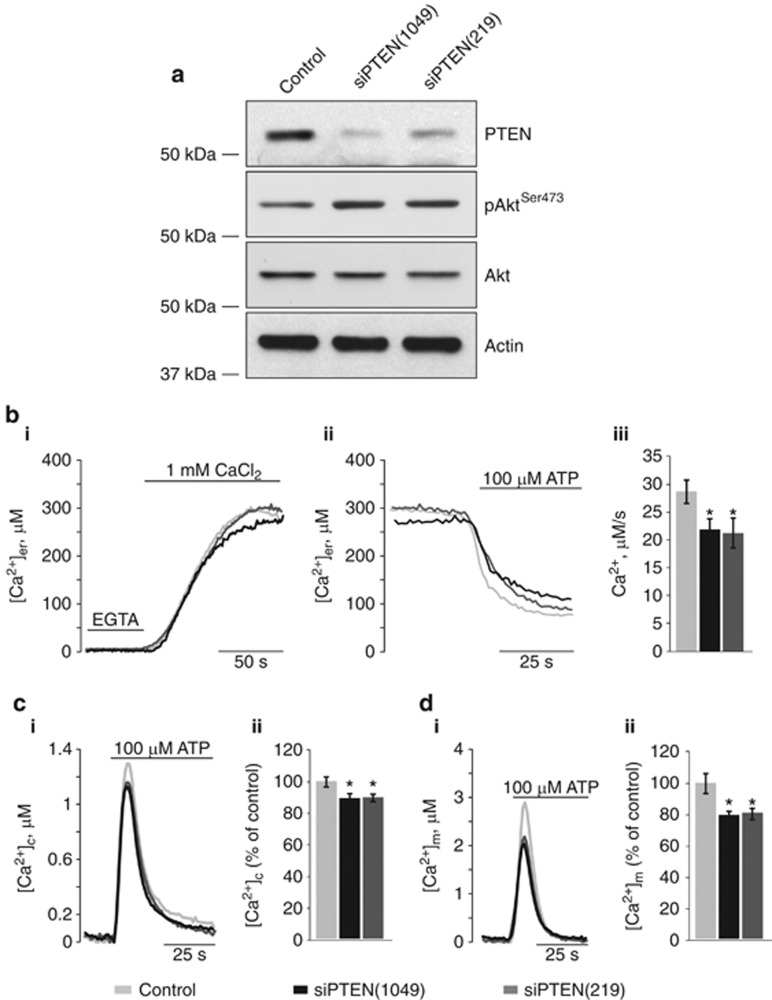
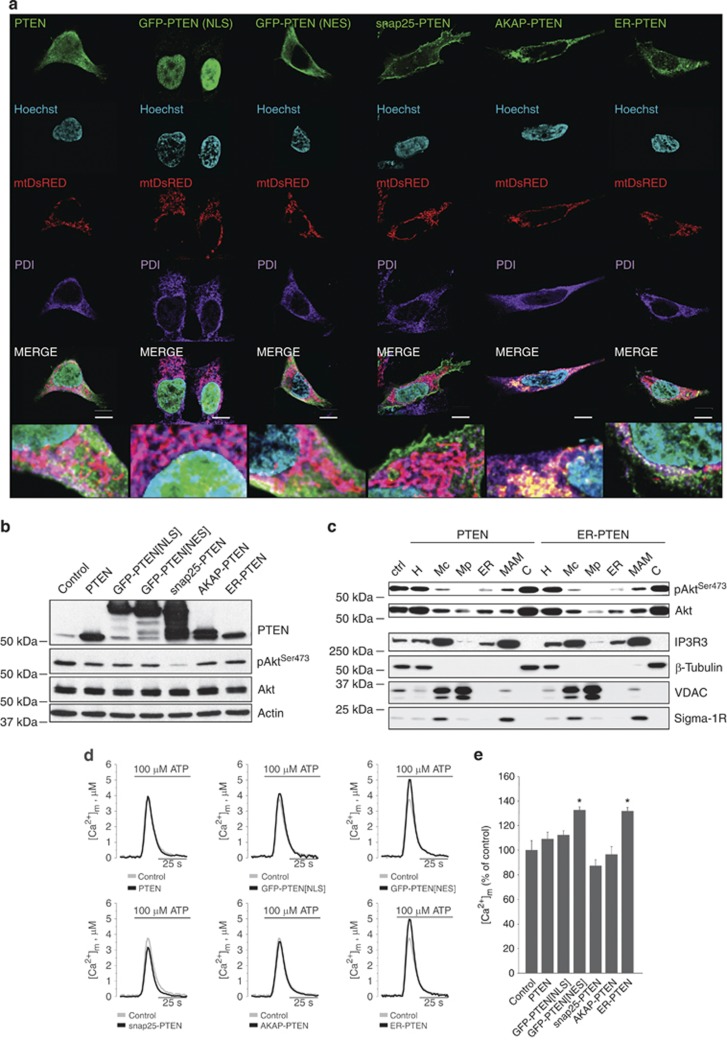
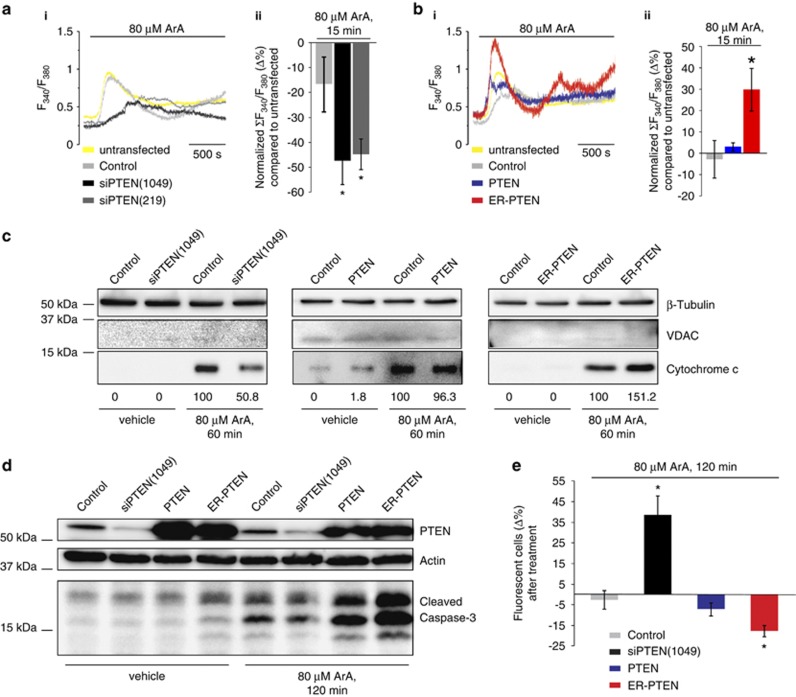
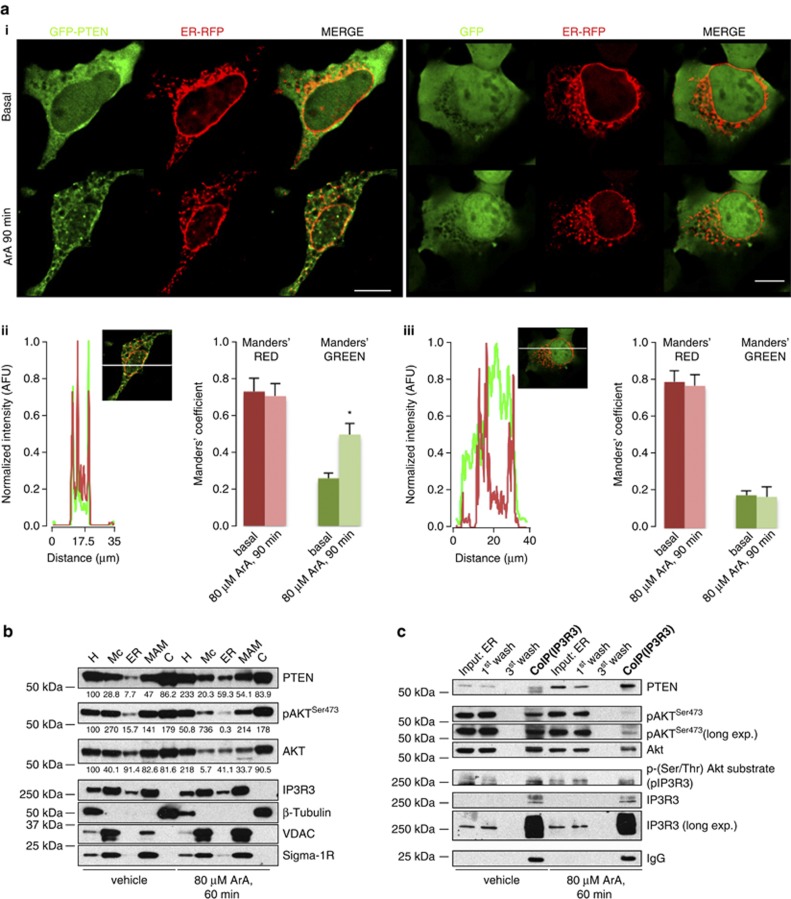
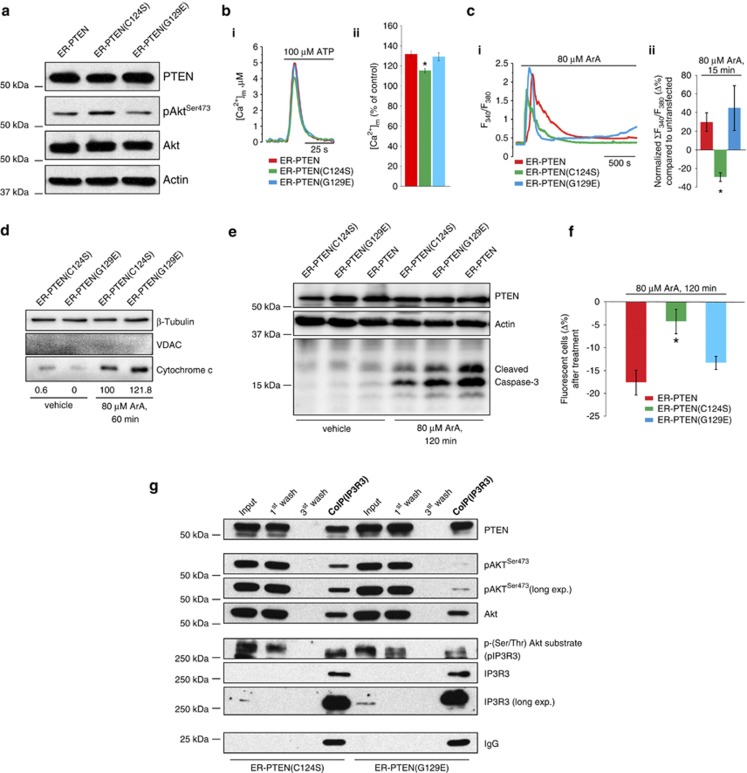
The tumor suppressor activity of PTEN (phosphatase and tensin homolog deleted on chromosome 10) is thought to be largely attributable to its lipid phosphatase activity. PTEN dephosphorylates the lipid second messenger phosphatidylinositol 3,4,5-trisphosphate to directly antagonize the phosphoinositide 3-kinase-Akt pathway and prevent the activating phosphorylation of Akt. PTEN has also other proposed mechanisms of action, including a poorly characterized protein phosphatase activity, protein-protein interactions, as well as emerging functions in different compartment of the cells such as nucleus and mitochondria. We show here that a fraction of PTEN protein localizes to the endoplasmic reticulum (ER) and mitochondria-associated membranes (MAMs), signaling domains involved in calcium ((2+)) transfer from the ER to mitochondria and apoptosis induction. We demonstrate that PTEN silencing impairs ER Ca(2+) release, lowers cytosolic and mitochondrial Ca(2+) transients and decreases cellular sensitivity to Ca(2+)-mediated apoptotic stimulation. Specific targeting of PTEN to the ER is sufficient to enhance ER-to-mitochondria Ca(2+) transfer and sensitivity to apoptosis. PTEN localization at the ER is further increased during Ca(2+)-dependent apoptosis induction. Importantly, PTEN interacts with the inositol 1,4,5-trisphosphate receptors (IP3Rs) and this correlates with the reduction in their phosphorylation and increased Ca(2+) release. We propose that ER-localized PTEN regulates Ca(2+) release from the ER in a protein phosphatase-dependent manner that counteracts Akt-mediated reduction in Ca(2+) release via IP3Rs. These findings provide new insights into the mechanisms and the extent of PTEN tumor-suppressive functions, highlighting new potential strategies for therapeutic intervention.


Figures

Figure 1
Figure 1
Subcellular localization of PTEN. (a) HEK-293 cells transfected with mtDsRED (mitochondria, red) were immunostained for PTEN (green), PDI (ER, blue) and loaded with Hoechst (nucleus, cyan). Merge images below show a succession of overlapping signals between: the four channels, PTEN and Hoechst, PTEN and mtDsRED, PTEN and PDI. Scale bar, 10 μm. Insets show magnified images. (b) Protein components of subcellular fractions prepared from HEK-293 cells revealed by western blot (WB) analysis. PTEN presence was shown using a specific monoclonal antibody. Akt presence was also verified in all fractions. Marker proteins indicate mitochondria (voltage-dependent anion channel, VDAC), ER (IP3R3), MAMs (Sigma-1R), cytosol (β-tubulin) and nucleus (lamin B1) (to exclude nuclear contamination). All markers were enriched in their respective compartments. The close apposition between ER and mitochondrial membranes at MAMs explained the presence of both VDAC and IP3R3 in these microdomains. H: homogenate; Mc: crude mitochondria; Mp: pure mitochondria; ER; MAM; and C: cytosol. (c) HEK-293 cells were subjected to subcellular fractionation. Mc fraction was further treated with PK, which can digest only those proteins that are not protected by closed phospholipidic bilayers. Hexokinase I (HK-I) was used as digestion control. Significant PK digestion of HK-I but not of VDAC was observed. The various fractions were immunoblotted with the indicated antibodies
Figure 2
Figure 2
Effects of PTEN silencing on intracellular Ca2+ homeostasis. (a) Western blot of HEK-293 lysates from mock- (control) or siRNAs-PTEN-(siPTEN) transfected cells, probed for PTEN, pAktSer473, total Akt and actin as loading control. (b) ER Ca2+ homeostasis. (bi) [Ca2+]er steady-state levels (321.1±27.30 μM for control n=10; 286.7±23.17 μM for siRNA-PTEN(1049) n=12; 293.9±27.59 μM for siRNA-PTEN(219) n=10); (bii) modifications of ER Ca2+ release kinetics after PTEN silencing; (biii) mean rate of ER Ca2+ release (Vmax: 28.68±2.12 μM/s for control n=10; 21.89±1.97 μM/s for siRNA-PTEN(1049) n=12, P<0.05; 21.25±2.69 μM/s for siRNA-PTEN(219) n=10, P<0.05). Representative traces of (ci) [Ca2+]c (peak values: 1.29±0.04 μM for control n=31; 1.15±0.04 μM for siRNA-PTEN(1049) n=34, P<0.05; 1.16±0.03 μM for siRNA-PTEN(219) n=34, P<0.05) and (di) mitochondrial Ca2+ transients ([Ca2+]m peak values: 2.43±0.15 μM for control n=14; 1.94±0.12 μM for siRNA-PTEN(1049) n=12, P<0.05; 1.97±0.10 μM for siRNA-PTEN(219) n=13, P<0.05). Percent of [Ca2+]c (c–ii) and [Ca2+]m (dii) peaks normalized to the mean of the control group. Mean±S.E.M. of variation is shown as percentage. Cells were transfected and [Ca2+] was measured as described in Materials and Method. Where indicated, cells were challenged with 100 μM ATP to induce Ca2+ release from the ER. Traces and bar graphs are representatives of ≥10 samples from at least three independent experiments that yielded similar results. *P<0.05
Figure 3
Figure 3
Subcellular targeting of PTEN differentially affects mitochondrial Ca2+ uptake. (a) Localization of recombinant wild-type PTEN and targeted PTEN chimeras in HEK-293 cells co-transfected with mtDsRED (mitochondria, red). Cells were immunostained for PTEN (green), PDI (ER, blue) and loaded with Hoechst (nucleus, cyan). Merge images show overlap between the four channels (white), and zoomed-in areas are below. Scale bars, 10 μm. (b) Western blot of HEK-293 lysates from mock-transfected cells (control) or cells overexpressing PTEN and targeted PTEN chimeras, probed for PTEN, pAktSer473, total Akt and actin. (c) WB analysis of pAktSer473 and total Akt levels from Percoll-purified subcellular fractions of HEK-293 cells transfected with recombinant wild-type PTEN or ER-PTEN. Untransfected cell homogenate (ctrl) was used as an indicator of Akt abundance and phosphorylation levels in physiological conditions. (d) Mitochondrial Ca2+ homeostasis modulation after PTEN, forced nuclear (NLS), cytoplasmic (NES), plasma membrane (snap25), OMM (AKAP) or ER chimeras overexpression (black) compared with control cells (gray); where indicated, cells were challenged with 100 μM ATP to induce Ca2+ release from the ER. (e) Percentage of [Ca2+]m peaks normalized to the mean of the control group. Mean±S.E.M. of variation is shown as percentage. Traces and bar graphs are representatives of ≥10 samples from at least three independent experiments that yielded similar results. *P<0.05
Figure 4
Figure 4
Effect of PTEN silencing, overexpression or targeting the outer surface of the ER on intracellular Ca2+ mobilization and apoptotic responses induced by ArA. (a and b) Cells were loaded with the Ca2+ indicator Fura-2/AM and untransfected cells in the same sample were used to compare changes in the 340/380 nm ratio. (a) Cytosolic Ca2+ increases induced by 80 μM ArA in PTEN-silenced cells, representative traces (i) and bars graphs (mean±S.E.M.) (ii) showing the change in percentage of cytosolic Ca2+ increases normalized as Σ(F340/F380) over time in comparison with untransfected cells (Δ%: −16.6±11.0 for control n=58 cells; −47.4±9.5 for siRNA-PTEN(1049) n=55 cells, P<0.05; −44.8±6.1 for siRNA-PTEN(219) n=59 cells, P<0.05). (b) Cytosolic Ca2+ increases induced by 80 μM ArA in cells overexpressing PTEN or ER-PTEN, representative traces (i) and bars graphs (mean±S.E.M.) (ii) showing the change in percentage of cytosolic Ca2+ increases normalized as Σ(F340/F380) over time in comparison with untransfected cells (Δ%: −2.8±8.8 for control n=25 cells; 3.1±2.0 for PTEN n=24 cells; 29.8±10.0 for ER-PTEN n=36 cells, P<0.05). (c) HEK-293 cells were transfected with siPTEN(1049), PTEN, ER-PTEN or subjected to mock transfection (control). At 36 h post-transfection, cells were treated with 80 μM ArA or vehicle (EtOH) for 60 min, then cytosolic fractions were purified using a digitonin-based subcellular fractionation technique and analyzed by WB for the detection of cytosolic cytochrome c. As a loading control, β-tubulin was used for the cytosolic fraction, whereas the presence of the mitochondrial protein VDAC was assessed as an indicator of the purity of fractions. Representative results are reported. Numbers indicate densitometrically determined cytochrome c levels relative to β-tubulin. (d) HEK-293 cells transfected as in (c) were treated with 80 μM ArA or vehicle for 120 min, then total cell lysates were prepared and analyzed by WB to compare cleaved caspase-3 (17 kDa) levels. Results are from a single experiment that is representative of four separate experiments. (e) Sensitivity to apoptosis in cells co-transfected with a fluorescent marker and siPTEN(1049), PTEN or ER-PTEN. After treatment with 80 μM ArA or vehicle for 120 min, the survival of transfected and non-transfected cells was compared. In these experiments, mock-transfected and PTEN-overexpressing cells show no difference in the percentage of fluorescent cells after ArA treatment (Δ% −2.5±4.6 and −7.1±3.2, respectively); therefore they both have the same sensitivity to the apoptotic stimulus and die to the same extent. In the same conditions, an increase in the apparent transfection efficiency of PTEN-silenced cells was observed (Δ% 38.5±9.4), indicating a decreased sensitivity to the apoptotic stimulus, whereas the reduced percentage of ER-PTEN-overexpressing fluorescent cells (Δ% −17.6±2.7) reflected a higher sensitivity to the apoptotic challenge. *P<0.05
Figure 5
Figure 5
Ca2+-dependent apoptosis induction increases PTEN localization to the ER and its interaction with IP3R3. (d) Colocalization between GFP-PTEN (left panels) or GFP (right panels) and ER-RFP, before and after treatment with 80 μM ArA for 90 min. The yellow signal in the merged images represents an overlapping spatial relationship between green and red fluorescence (i). The plots below show the normalized fluorescence intensity profiles after ArA treatment measured along a line of pixels that crossed the cell (thick white line in the micrograph) for GFP-PTEN and ER-RFP (ii) or GFP and ER-RFP (iii). The bar graphs show the proportion of overlap of each channel with the other for data represented in (i) using the pixel intensity spatial correlation methods of Manders. Manders' overlap coefficients are reported as mean±S.E.M. of three independent experiments. (b) Immunoblot of PTEN, pAktSer473 and total Akt protein levels in subcellular fractions prepared from HEK-293 cells treated with 80 μM ArA or vehicle (EtOH) for 60 min. Numbers indicate densitometrically determined protein levels relative to the marker of the corresponding fraction for Akt and PTEN or to markers normalized Akt for pAktSer473. (c) ER fractions prepared as in (b) were used for co-immunoprecipitation of endogenous IP3R3 with PTEN and Akt. Using IP3R3 as bait, the levels of pIP3R3 can be detected by p-(Ser/Thr)-Akt substrates antibody reactivity at the same molecular weight of IP3R3 (∼250 kDa), assuming that it represents the phosphorylation state of IP3R3. In the same blot the levels of pAktSer473 are shown. *P<0.001
Figure 6
Figure 6
ER Ca2+ mobilization and apoptotic responses are differentially regulated by PTEN lipid and protein phosphatase activity. (a) PTEN expression and Akt phosphorylation were verified by WB of HEK-293 lysates transfected with ER-PTEN-, ER-PTEN(C124S)- or ER-PTEN(G129E)-encoding plasmids. (b) Representative traces of mitochondrial Ca2+ transients (i). Percentage of [Ca2+]m peaks normalized to the mean of the control group (Figure 3e) (ii). (c) Cytosolic Ca2+ response induced by 80 μM ArA presented as the ratio of fluorescence at 340/380 nm (i). Change in percentage of cytosolic Ca2+ increases normalized as Σ(F340/F380) over time in comparison with untransfected cells (ii) (Δ%: 29.8±10.0 for ER-PTEN; −29.4±4.7 for ER-PTEN(C124S), P<0.001; 45.1±24.1 for ER-PTEN(G129E). (d) HEK-293 cells were either transfected with plasmid encoding ER-PTEN(C124S) or ER-PTEN(G129E). Following ArA treatment, cytosolic fractions were purified and analyzed by WB for the detection of cytosolic cytochrome c. β-Tubulin was used as loading control and VDAC was assessed as an indicator of the purity of fractions. Representative results are reported. Numbers indicate densitometrically determined cytochrome c levels relative to β-tubulin. (e) HEK-293 cells transfected as in (a) were treated with 80 μM ArA or vehicle for 120 min, then total cell lysates were prepared and analyzed by WB to compare cleaved caspase-3 levels. Results are from a single experiment that is representative of three separate experiments. (f) Sensitivity to apoptosis in cells co-transfected with a fluorescent marker and plasmid encoding ER-PTEN, ER-PTEN(C124S) or ER-PTEN(G129E). The bars graph shows the change in percentage of fluorescent cells in the surviving cell population upon ArA treatment. *P<0.05. (g) Co-immunoprecipitation of endogenous IP3R3, Akt and ER-PTEN(C124S) or ER-PTEN(G129E). In the same blot, the levels of p-IP3R3 and pAktSer473 are shown. *P<0.05

References

    1. Salmena L, Carracedo A, Pandolfi PP. Tenets of PTEN tumor suppression. Cell. 2008;133:403–414. - PubMed
    1. Eng C. PTEN: one gene, many syndromes. Hum Mutat. 2003;22:183–198. - PubMed
    1. Maehama T, Dixon JE. The tumor suppressor, PTEN/MMAC1, dephosphorylates the lipid second messenger, phosphatidylinositol 3,4,5-trisphosphate. J Biol Chem. 1998;273:13375–13378. - PubMed
    1. Myers MP, Stolarov JP, Eng C, Li J, Wang SI, Wigler MH, et al. P-TEN, the tumor suppressor from human chromosome 10q23, is a dual-specificity phosphatase. Proc Natl Acad Sci USA. 1997;94:9052–9057. - PMC - PubMed
    1. Stambolic V, Suzuki A, de la Pompa JL, Brothers GM, Mirtsos C, Sasaki T, et al. Negative regulation of PKB/Akt-dependent cell survival by the tumor suppressor PTEN. Cell. 1998;95:29–39. - PubMed

Publication types