. 2013 Aug;14(8):840-8.
doi: 10.1038/ni.2642. Epub 2013 Jun 30.

The microRNA cluster miR-17∼92 promotes TFH cell differentiation and represses subset-inappropriate gene expression

Affiliations

The microRNA cluster miR-17∼92 promotes TFH cell differentiation and represses subset-inappropriate gene expression

Dirk Baumjohann et al. Nat Immunol. 2013 Aug.

Abstract

Follicular helper T cells (TFH cells) are the prototypic helper T cell subset specialized to enable B cells to form germinal centers (GCs) and produce high-affinity antibodies. We found that expression of microRNAs (miRNAs) by T cells was essential for TFH cell differentiation. More specifically, we show that after immunization of mice with protein, the miRNA cluster miR-17∼92 was critical for robust differentiation and function of TFH cells in a cell-intrinsic manner that occurred regardless of changes in proliferation. In a viral infection model, miR-17∼92 restrained the expression of genes 'inappropriate' to the TFH cell subset, including the direct miR-17∼92 target Rora. Removal of one Rora allele partially 'rescued' the inappropriate gene signature in miR-17∼92-deficient TFH cells. Our results identify the miR-17∼92 cluster as a critical regulator of T cell-dependent antibody responses, TFH cell differentiation and the fidelity of the TFH cell gene-expression program.


Figures

Figure 1
Figure 1. T cell-expressed miRNAs are essential for TFH cell differentiation and germinal center B cell induction
(a) Naïve CD45.2+R26-YFP+ OT-II cells from CD4-Cre+Dgcr8+/fl (Dgcr8+/∆) control or CD4-Cre+Dgcr8fl/fl (Dgcr8∆/∆) donor mice were adoptively transferred into wild-type mice (CD45.1+) and hosts were immunized with NP-OVA/alum subcutaneously (s.c.) in the hind footpads. Draining LNs were analyzed by flow cytometry on day +4.5. Representative contour plots show the frequency of CD45.2+ OT-II cells among total CD4+ T cells as well as the frequency of CXCR5+PD-1+ TFH cells among transferred OT-II cells. Gated on live CD4+B220 lymphocytes. Data are quantified in the bar graphs with each dot representing one mouse (n = 5). (b) Representative contour plots and quantification of GC B cells in the draining LN. B cells were gated as live CD19+B220+ lymphocytes. (c) Naïve CD45.2+R26-YFP+ OT-II cells from control or Dgcr8∆/∆ donor mice were labeled with CTV and adoptively transferred into wild-type recipients, followed by OVA/alum immunization in the hind footpads. Draining popliteal LNs were dissected on day +3.5 after immunization and analyzed by flow cytometry for Bcl-6 and CXCR5 expression kinetics. Unimmunized OT-II cell-recipients served as controls. OT-II cells were gated as live CD45.2+CD4+B220 lymphocytes. Data are representative of three (a, b) and five (c) independent experiments.
Figure 2
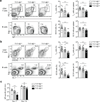
Figure 2. miR-17~92 regulates TFH and germinal center responses
(a) CD4-Cre+miR-17~92+/+ or CD4-CremiR-17~92fl/fl control mice (referred to as T17~92+/+), CD4-Cre+miR-17~92+/fl (T17~92+/∆), and CD4-Cre+miR-17~92fl/fl (T17~92∆/∆) mice were infected intraperitoneally (i.p.) with LCMV Armstrong. Spleens were dissected on day +8 after infection and analyzed by flow cytometry. Representative contour plots show the frequency of CXCR5hiPD-1hi TFH cells among CD4+ T cells (top panels) as well as the frequency of FAS+IgDlow GC B cells among CD19+B220+ B cells (bottom panels). Frequencies and total TFH and GC B cell numbers are quantified in the bar graphs. Data are pooled from three independent experiments and each dot represents one mouse (n = 12–17). (b) T17~92+/+ control, T17~92+/∆, and T17~92∆/∆ mice were immunized s.c. with NP-OVA/alum in the hind foot pads. Draining LNs were analyzed by flow cytometry on day +7. Contour plots show the percentage of TFH cells among activated (CD44hi) CD4+ T cells (top panels) as well as the percentage of FAS+GL-7+ GC B cells among CD19+B220+ B cells. Frequencies and total TFH and GC B cell numbers are quantified in the bar graphs. Data are pooled from three independent experiments and each dot represents one mouse (n = 12–24). (c) NP-specific serum IgG1 antibody levels (arbitrary units, AU) of NP-OVA/alum immunized T17~92+/+ control, T17~92+/∆, and T17~92∆/∆ mice. Data are representative of two independent experiments.
Figure 3
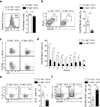
Figure 3. miR-17~92 is required for robust TFH cell differentiation
(a) Naïve OT-II cells derived from T17~92+/+ control and T17~92∆/∆ mice were labeled with CTV and adoptively transferred into wild-type recipients, followed by NP-OVA/alum immunization in the hind footpads. Draining popliteal LNs were dissected on day +3.5 after immunization and analyzed by flow cytometry. Representative histogram overlays show CTV dilution of transferred control (grey shaded) and miR-17~92∆/∆ (black line) OT-II cells. The proliferation index for each replicate is quantified in the bar graph (n = 7). (b) Representative contour plots and quantification of CXCR5hiBcl-6hi TFH cells among the transferred OT-II cells. (c) Representative dot plots show Bcl-6 and CXCR5 expression kinetics of dividing OT-II cells on day +3.5. (d) Frequency of Bcl-6 and CXCR5 double-positive OT-II cells in relation to their cell division status (n = 7 mice). (e) Representative dot plots and quantification of IL-21-producing OT-II cells. (f) Representative contour plots and quantification of CXCR5CD25+ OT-II cells. Data are representative of five (a-d, f) and two (e) independent experiments.
Figure 4
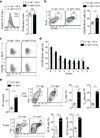
Figure 4. T cell-intrinsic miR-17~92 cluster overexpression promotes TFH cell differentiation
(a) Naïve OT-II cells derived from T17~92+/+ control and CD4-Cre+Rosa-26-miR-17~92tg/tg (miR-17~92tg/tg) mice were labeled with CTV and adoptively transferred into wild-type recipients, followed by NP-OVA/alum immunization in the hind footpads. Representative histogram overlays show CTV dilution of transferred control (grey shaded) and miR-17~92tg/tg (black line) OT-II cells on day +3.5. The proliferation index for each replicate is quantified in the bar graph (n = 5–7). (b) Quantification of CXCR5hiBcl-6hi TFH cells among the transferred OT-II cells. (c) Bcl-6 and CXCR5 expression kinetics of dividing OT-II cells on day +3.5. (d) Frequency of Bcl-6 and CXCR5 double-positive OT-II cells in relation to their cell division status (n = 5–7 mice). Data are representative of four independent experiments. (e) Peyer’s patches (PPs) were isolated from 10-week-old, unimmunized control (T17~92+/+) and CD4-Cre+miR17~92tg/+ (T17~92tg/+) mice and analyzed by flow cytometry. To allow for comparison of total PP cellularity, equal numbers of PPs were collected for each mouse. Representative contour plots show the frequency of CXCR5hiPD-1hi TFH cells among CD4+ T cells and the frequency of FAS+GL-7+ GC B cells among CD19+ B cells. Data is quantified in the bar graphs (n = 5).
Figure 5
Figure 5. miR-17~92 enforces fidelity of the TFH cell gene expression program
(a) Naïve LCMV-specific SMARTA (SM) cells derived from T17~92+/+ control and T17~92∆/∆ mice were adoptively transferred into wild-type recipients, followed by i.p. LCMV Armstrong infection. Spleens were dissected on day +5.5 after infection and analyzed by flow cytometry for identification of CXCR5hiPD-1hi TFH and CXCR5 non-TFH cells. (b) Genome-wide transcriptome analysis of 17~92∆/∆ and 17~92+/+ control SMARTA TFH cells on day +5.5 post LCMV Armstrong infection. The graphs display the log2 value of the gene expression ratio of 17~92∆/∆ divided by 17~92+/+ cells for each gene (x-axis) plotted against the cumulative fraction of all log2 ratios (y-axis). The curves show the values for all genes (black), computationally predicted miRNA target genes for the miRNA indicated above each plot (blue) or the genes with computationally predicted 8mer seed matches (red). Computationally predicted miR-29 target genes are shown as a negative control. (c) MA plot shows genome-wide transcriptome analysis of 17~92∆/∆ and 17~92+/+ control SMARTA TFH cells with significantly upregulated and downregulated genes (raw p<0.01) marked in red. Selected TFH subset-inappropriate genes upregulated in the 17~92∆/∆ SMARTA TFH cells are depicted. (d) Histograms show CCR6 and IL1R2 expression by non-TFH and TFH (as defined by the gates shown in (a)) 17~92+/+ control and 17~92∆/∆ SMARTA cells on day +5.5 after LCMV infection. Data are quantified in the bar graphs with each dot representing one mouse (n = 6–7). (e) Analysis of Il1r1 and Rora expression in 17~92+/+ control and 17~92∆/∆ SMARTA TFH cells on day +5.5 after LCMV infection. Expression was normalized to Hprt1 (n = 5). (f) Quantification of the relative numbers of IL-22- and/or IL-17A–producing 17~92+/+ control and 17~92∆/∆ SMARTA cells on day +5.5 post infection following restimulation with PMA/ionomycin (n = 6–7).
Figure 6
Figure 6. RAR-related orphan receptor alpha (Rora) is a functionally relevant miR-17~92 target
(a) In vitro stimulated OT-II cells from T17~92+/+ control, T17~92∆/∆, and T17~92tg/tg mice were transfected with dual luciferase reporters that contained mouse 3’ UTR P1 or P2 of Rora (compare Methods and Supplementary Fig. 7 for details). Transfection with empty vector (EV) served as control. Renilla luciferase activity was measured 24 hours after transfection and normalized to firefly luciferase activity in transfected 17~92+/+ control OT-II cells. Data are representative of three independent experiments. (b) Primary CD4-Cre+Dgcr8fl/fl CD4+ T cells were used for co-transfection with 3’ UTR P1 or P2 dual luciferase reporters and with the indicated miR-17~92 cluster miRNA or control miRNA mimics. Renilla luciferase activity was measured 24 hours after transfection and normalized to firefly luciferase activity. Values are relative to normalized luciferase in control-transfected cells. Data are representative of two independent experiments. (c) Naïve LCMV-specific SMARTA (SM) cells derived from T17~92+/+Rora+/+ control, T17~92∆/∆Rora+/+ or T17~92∆/∆Rora+/– mice were adoptively transferred into wild-type recipients, followed by i.p. LCMV infection. Histograms show CCR6 and IL1R2 expression by non-TFH and TFH SMARTA cells of the indicated genotypes on day +5.5 after LCMV infection. Data are quantified in the bar graphs with each dot representing one mouse (n = 7–9). (d) Representative contour plots show RORγt and CXCR5 expression among SMARTA cells of the indicated genotypes. (e) Quantification of IL-22- and/or IL-17A–producing SMARTA cells on day +5.5 post infection following restimulation with PMA/ionomycin (n = 7–9).

Comment in

References

    1. Crotty S. Follicular helper CD4 T cells (TFH) Annu. Rev. Immunol. 2011;29:621–663. - PubMed
    1. Vinuesa CG, Sanz I, Cook MC. Dysregulation of germinal centres in autoimmune disease. Nat. Rev. Immunol. 2009;9:845–857. - PubMed
    1. Johnston RJ, et al. Bcl6 and Blimp-1 are reciprocal and antagonistic regulators of T follicular helper cell differentiation. Science. 2009;325:1006–1010. - PMC - PubMed
    1. Nurieva RI, et al. Bcl6 mediates the development of T follicular helper cells. Science. 2009;325:1001–1005. - PMC - PubMed
    1. Yu D, et al. The transcriptional repressor Bcl-6 directs T follicular helper cell lineage commitment. Immunity. 2009;31:457–468. - PubMed

Publication types

MeSH terms

Substances

Associated data