

Longitudinal change in CSF Tau and Aβ biomarkers for up to 48 months in ADNI
- PMID: 23812320
- PMCID: PMC3875373
- DOI: 10.1007/s00401-013-1151-4
Longitudinal change in CSF Tau and Aβ biomarkers for up to 48 months in ADNI
Abstract
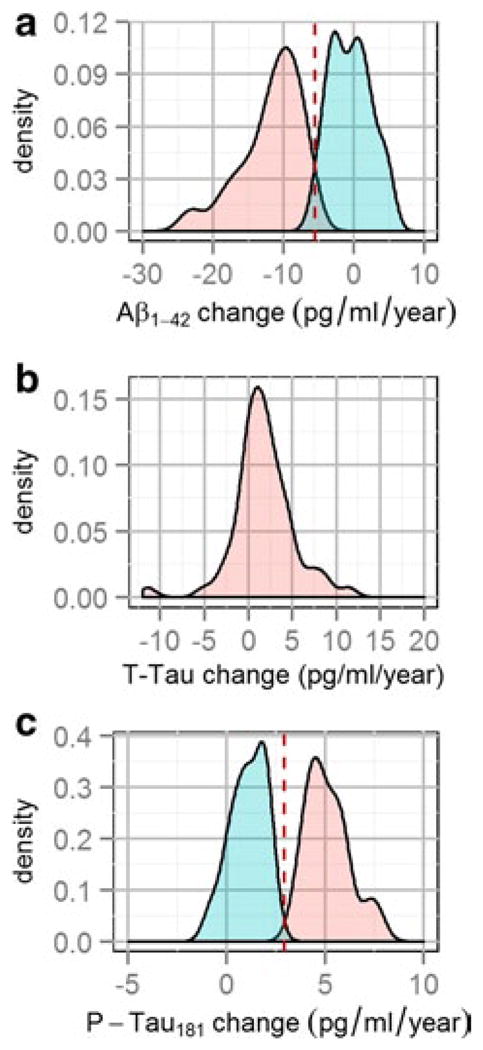
The dynamics of cerebrospinal fluid (CSF) tau and Aβ biomarkers over time in Alzheimer's disease (AD) patients from prodromal pre-symptomatic to severe stages of dementia have not been clearly defined and recent studies, most of which are cross-sectional, present conflicting findings. To clarify this issue, we analyzed the longitudinal CSF tau and Aβ biomarker data from 142 of the AD Neuroimaging Initiative (ADNI) study subjects [18 AD, 74 mild cognitive impairment (MCI), and 50 cognitively normal subjects (CN)]. Yearly follow-up CSF collections and studies were conducted for up to 48 months (median = 36 months) for CSF Aβ1-42, phosphorylated tau (p-tau181), and total tau (t-tau). An unsupervised analysis of longitudinal measurements revealed that for Aβ1-42 and p-tau181 biomarkers there was a group of subjects with stable longitudinal CSF biomarkers measures and a group of subjects who showed a decrease (Aβ1-42, mean = -9.2 pg/ml/year) or increase (p-tau181, mean = 5.1 pg/ml/year) of these biomarker values. Low baseline Aβ1-42 values were associated with longitudinal increases in p-tau181. Conversely, high baseline p-tau181 values were not associated with changes in Aβ1-42 levels. When the subjects with normal baseline biomarkers and stable concentrations during follow-up were excluded, the expected time to reach abnormal CSF levels and the mean AD values was significantly shortened. Thus, our data demonstrate for the first time that there are distinct populations of ADNI subjects with abnormal longitudinal changes in CSF p-tau181 and Aβ1-42 levels, and our longitudinal results favor the hypothesis that Aβ1-42 changes precede p-tau181 changes.
Figures


References
-
- Bateman RJ, Xiong C, Benzinger TL, Fagan AM, Goate A, Fox NC, Marcus DS, Cairns NJ, Xie X, Blazey TM, Holtzman DM, Santacruz A, Buckles V, Oliver A, Moulder K, Aisen PS, Ghetti B, Klunk WE, McDade E, Martins RN, Masters CL, Mayeux R, Ringman JM, Rossor MN, Schofield PR, Sperling RA, Salloway S, Morris JC. Clinical and biomarker changes in dominantly inherited Alzheimer’s disease. N Engl J Med. 2012;367(9):795–804. doi: 10.1056/NEJMoa1202753. - DOI - PMC - PubMed
-
- Bates DM, Chambers JM. Nonlinear models. In: Hastie TJ, Chambers JM, editors. Statistical Models. S. Wadsworth & Brooks/Cole; Pacific Grove, California: 1992.
-
- Bouwman FH, van der Flier WM, Schoonenboom NS, van Elk EJ, Kok A, Rijmen F, Blankenstein MA, Scheltens P. Longitudinal changes of CSF biomarkers in memory clinic patients. Neurology. 2007;69(10):1006–1011. 10.1212/01. wnl.0000271375.37131.04. - PubMed
-
- Buchhave P, Minthon L, Zetterberg H, Wallin AK, Blennow K, Hansson O. Cerebrospinal fluid levels of beta-amyloid 1–42, but not of tau, are fully changed already 5 to 10 years before the onset of Alzheimer dementia. Arch Gen Psychiatry. 2012;69(1):98–106. doi: 10.1001/archgenpsychiatry.2011.155. - DOI - PubMed
Publication types
MeSH terms
Substances
Grants and funding
LinkOut - more resources
Full Text Sources
Other Literature Sources
Medical
