

Inference of historical migration rates via haplotype sharing
- PMID: 23812983
- PMCID: PMC3694674
- DOI: 10.1093/bioinformatics/btt239
Inference of historical migration rates via haplotype sharing
Abstract
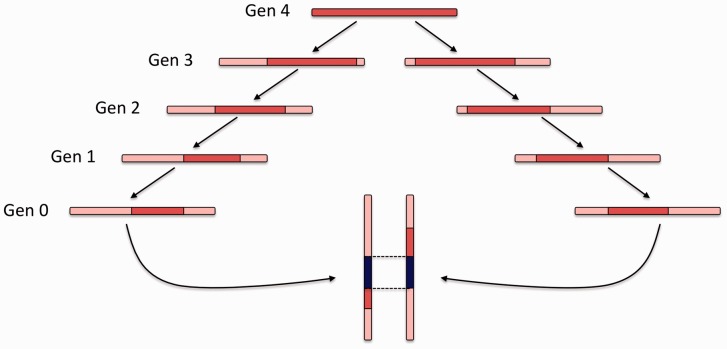
Summary: Pairs of individuals from a study cohort will often share long-range haplotypes identical-by-descent. Such haplotypes are transmitted from common ancestors that lived tens to hundreds of generations in the past, and they can now be efficiently detected in high-resolution genomic datasets, providing a novel source of information in several domains of genetic analysis. Recently, haplotype sharing distributions were studied in the context of demographic inference, and they were used to reconstruct recent demographic events in several populations. We here extend the framework to handle demographic models that contain multiple demes interacting through migration. We extensively test our formulation in several demographic scenarios, compare our approach with methods based on ancestry deconvolution and use this method to analyze Masai samples from the HapMap 3 dataset.
Availability: DoRIS, a Java implementation of the proposed method, and its source code are freely available at http://www.cs.columbia.edu/~pier/doris.
Figures
 and
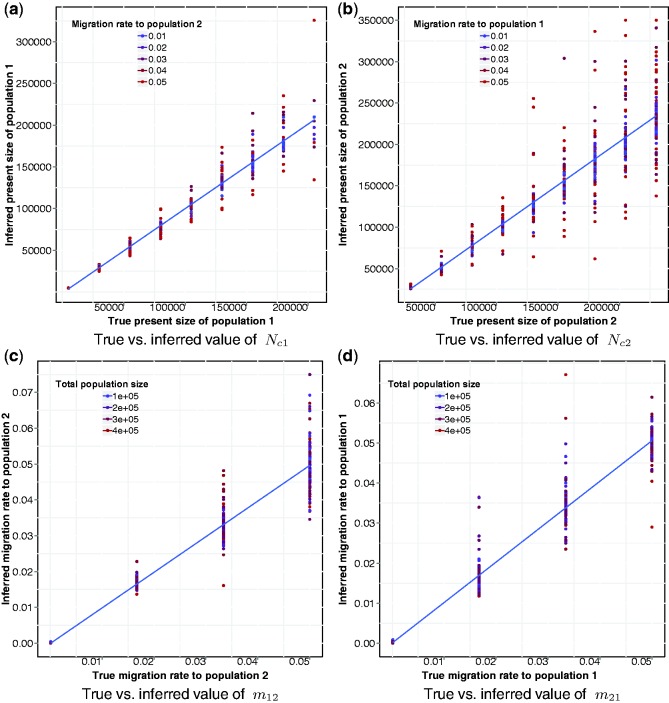
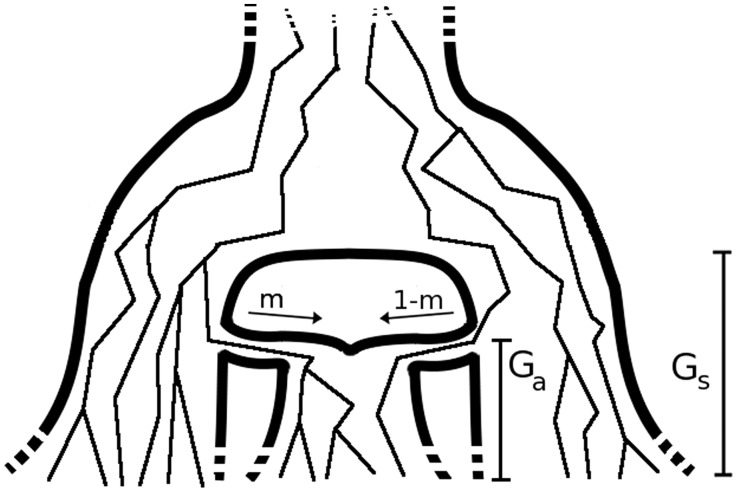
and  individuals to
  and
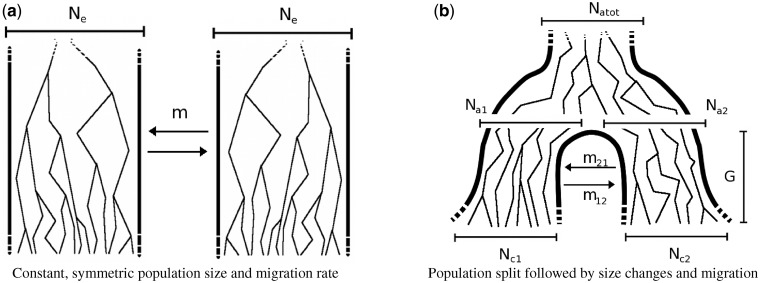
and  individuals during G generations. During this period, the populations interact with asymmetric migration rates m12 and m21
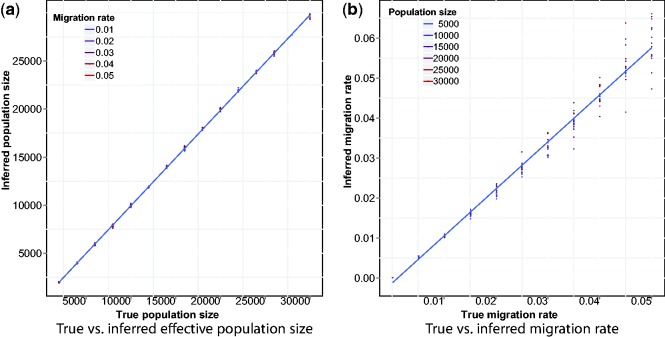
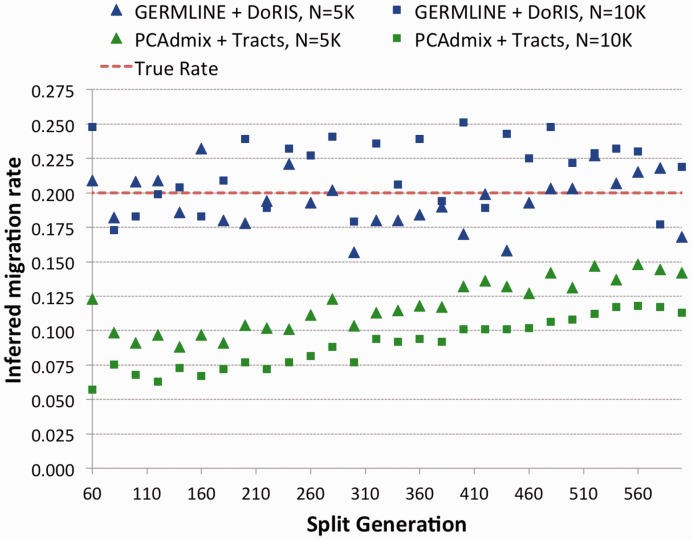
 , and using constant populations of size 5000 or 10 000 diploid individuals. We inferred the value of m using PCAdmix + Tracts, or GERMLINE + DoRIS, here reported as a function of Gs
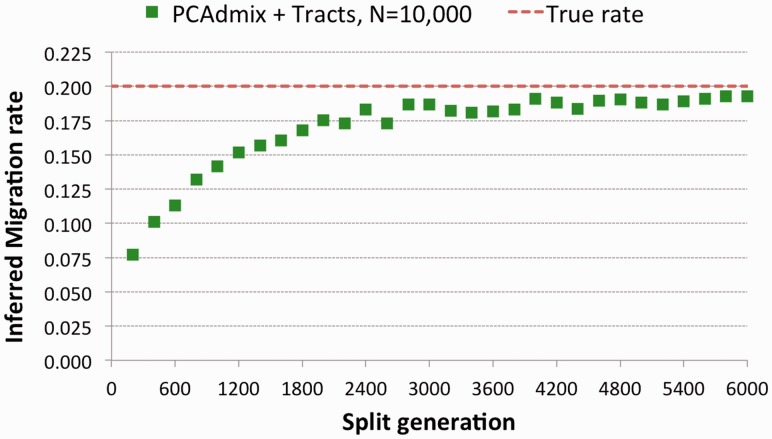
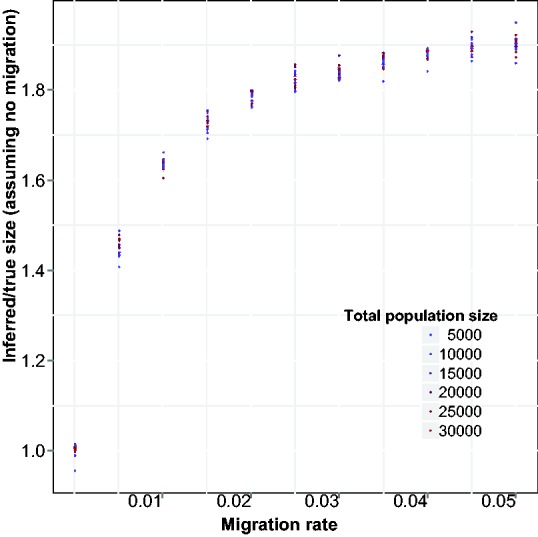
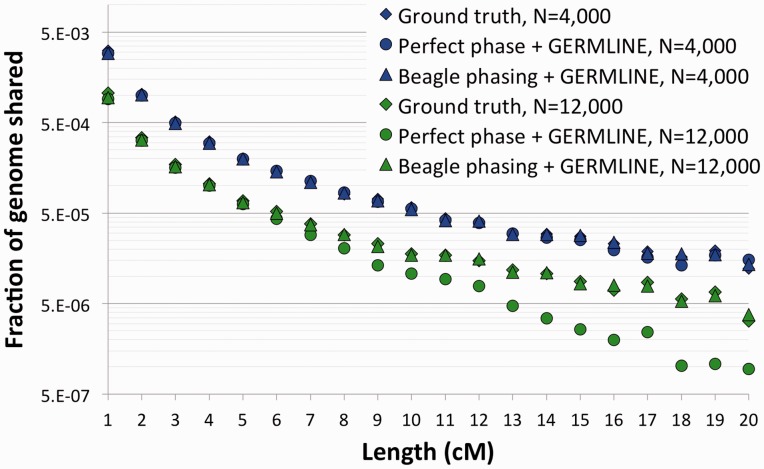
 with population sizes of 10 000 diploid individuals. We inferred the value of m using PCAdmix + Tracts from phased genotype data
References
Publication types
MeSH terms
Grants and funding
LinkOut - more resources
Full Text Sources
Other Literature Sources
Miscellaneous
