

Phylogenetic analysis of multiprobe fluorescence in situ hybridization data from tumor cell populations
- PMID: 23812984
- PMCID: PMC3694640
- DOI: 10.1093/bioinformatics/btt205
Phylogenetic analysis of multiprobe fluorescence in situ hybridization data from tumor cell populations
Abstract
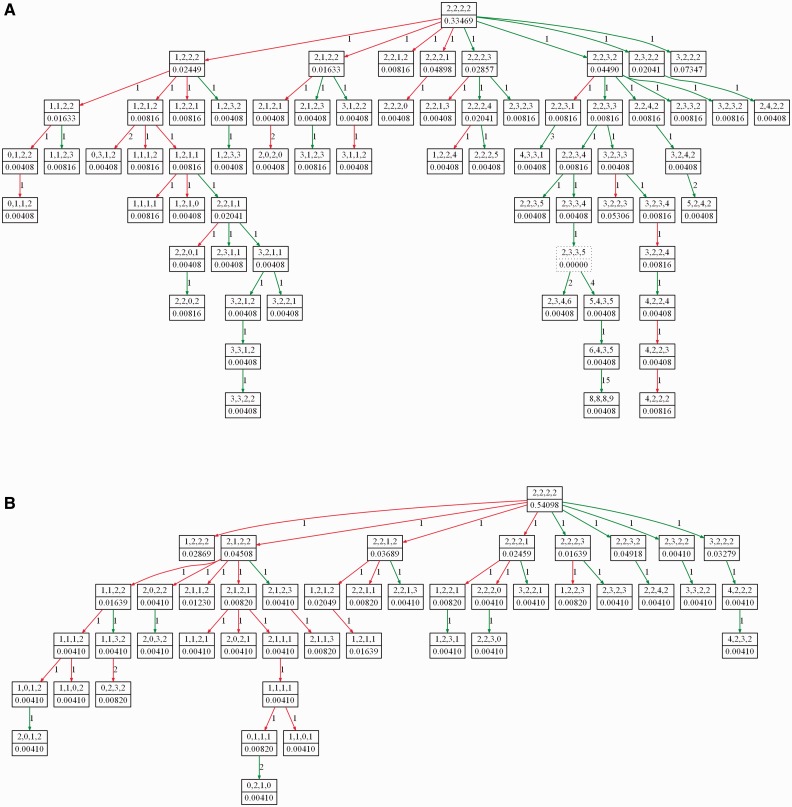
Motivation: Development and progression of solid tumors can be attributed to a process of mutations, which typically includes changes in the number of copies of genes or genomic regions. Although comparisons of cells within single tumors show extensive heterogeneity, recurring features of their evolutionary process may be discerned by comparing multiple regions or cells of a tumor. A useful source of data for studying likely progression of individual tumors is fluorescence in situ hybridization (FISH), which allows one to count copy numbers of several genes in hundreds of single cells. Novel algorithms for interpreting such data phylogenetically are needed, however, to reconstruct likely evolutionary trajectories from states of single cells and facilitate analysis of tumor evolution.
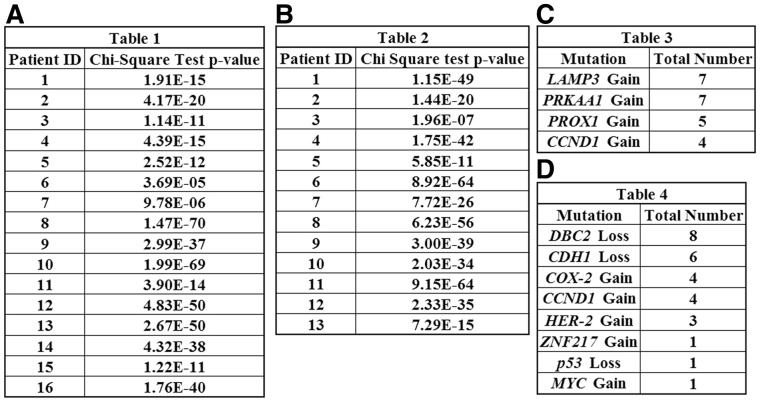
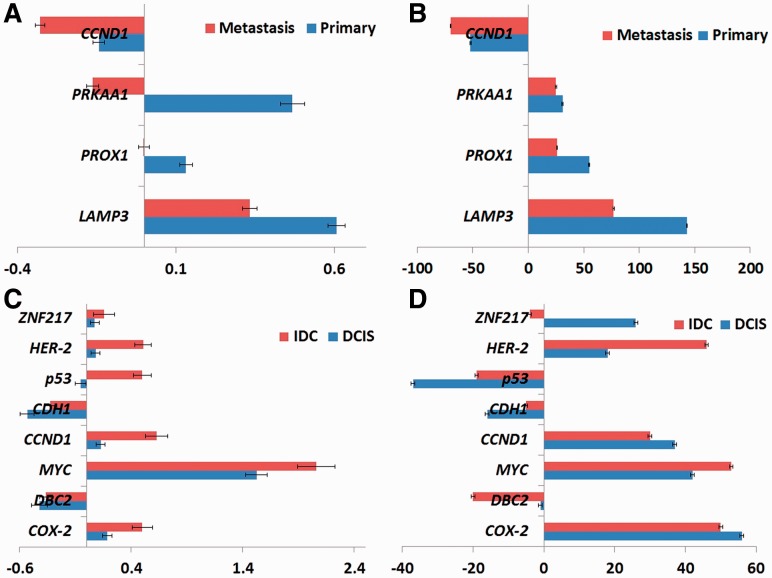
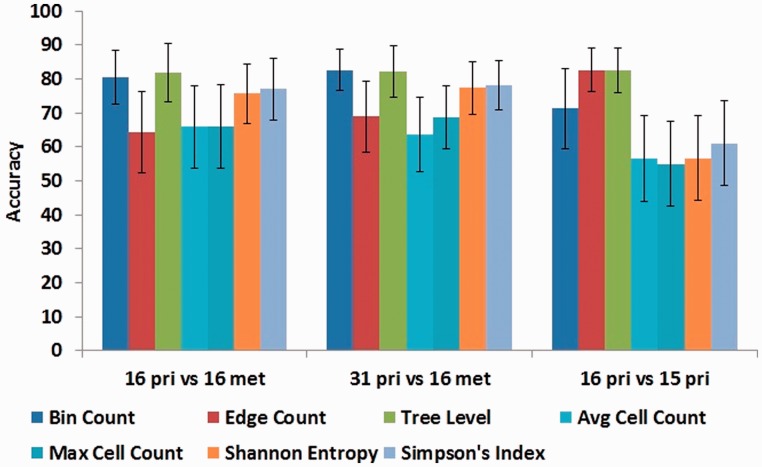
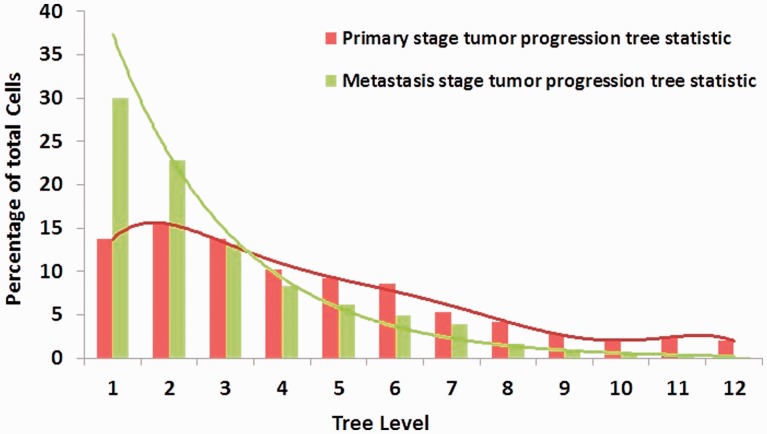
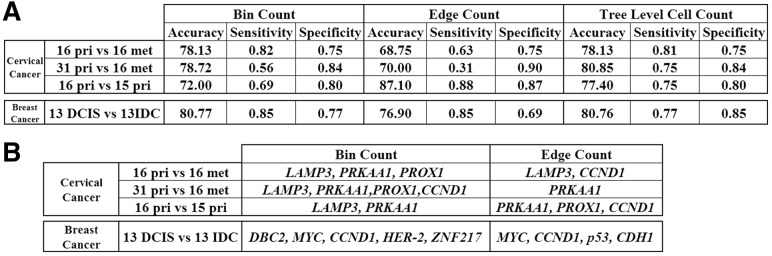
Results: In this article, we develop phylogenetic methods to infer likely models of tumor progression using FISH copy number data and apply them to a study of FISH data from two cancer types. Statistical analyses of topological characteristics of the tree-based model provide insights into likely tumor progression pathways consistent with the prior literature. Furthermore, tree statistics from the resulting phylogenies can be used as features for prediction methods. This results in improved accuracy, relative to unstructured gene copy number data, at predicting tumor state and future metastasis.
Availability: Source code for software that does FISH tree building (FISHtrees) and the data on cervical and breast cancer examined here are available at ftp://ftp.ncbi.nlm.nih.gov/pub/FISHtrees.
Supplementary information: Supplementary data are available at Bioinformatics online.
Figures
References
-
- Attolini CS-O, Michor F. Evolutionary theory of cancer. Ann. NY. Acad. Sci. 2009;1168:23–51. - PubMed
-
- Bandelt H-J, et al. Median-joining networks for inferring intraspecific phylogenies. Mol. Biol. Evol. 1999;16:37–48. - PubMed
-
- Beerenwinkel N, et al. Mtreemix: a software package for learning and using mixture models of mutagenetic trees. Bioinformatics. 2005;21:2106–2107. - PubMed
-
- Birchmeier W, Behrens J. Cadherin expression in carcinomas: role in the formation of cell junctions and the prevention of invasiveness. Biochim. Biophys. Acta. 1994;1198:11–26. - PubMed
-
- Bleyer A, Welch G. Effects of three decades of screening mammography on breast-cancer incidence. New Engl. J. Med. 2012;367:1998–2005. - PubMed
Publication types
MeSH terms
Grants and funding
LinkOut - more resources
Full Text Sources
Other Literature Sources
Medical
