Hard-wired heterogeneity in blood stem cells revealed using a dynamic regulatory network model
- PMID: 23813012
- PMCID: PMC3694641
- DOI: 10.1093/bioinformatics/btt243
Hard-wired heterogeneity in blood stem cells revealed using a dynamic regulatory network model
Abstract
Motivation: Combinatorial interactions of transcription factors with cis-regulatory elements control the dynamic progression through successive cellular states and thus underpin all metazoan development. The construction of network models of cis-regulatory elements, therefore, has the potential to generate fundamental insights into cellular fate and differentiation. Haematopoiesis has long served as a model system to study mammalian differentiation, yet modelling based on experimentally informed cis-regulatory interactions has so far been restricted to pairs of interacting factors. Here, we have generated a Boolean network model based on detailed cis-regulatory functional data connecting 11 haematopoietic stem/progenitor cell (HSPC) regulator genes.
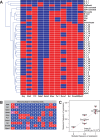
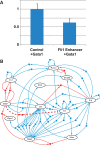
Results: Despite its apparent simplicity, the model exhibits surprisingly complex behaviour that we charted using strongly connected components and shortest-path analysis in its Boolean state space. This analysis of our model predicts that HSPCs display heterogeneous expression patterns and possess many intermediate states that can act as 'stepping stones' for the HSPC to achieve a final differentiated state. Importantly, an external perturbation or 'trigger' is required to exit the stem cell state, with distinct triggers characterizing maturation into the various different lineages. By focusing on intermediate states occurring during erythrocyte differentiation, from our model we predicted a novel negative regulation of Fli1 by Gata1, which we confirmed experimentally thus validating our model. In conclusion, we demonstrate that an advanced mammalian regulatory network model based on experimentally validated cis-regulatory interactions has allowed us to make novel, experimentally testable hypotheses about transcriptional mechanisms that control differentiation of mammalian stem cells.
Supplementary information: Supplementary data are available at Bioinformatics online.
Figures


References
-
- Bockamp EO, et al. Transcriptional regulation of the stem cell leukemia gene by PU.1 and Elf-1. J. Biol. Chem. 1998;273:29032–29042. - PubMed
-
- Bonzanni N, et al. Executing multicellular differentiation: quantitative predictive modelling of C.elegans vulval development. Bioinformatics. 2009a;25:2049–2056. - PubMed
-
- Bonzanni N, et al. FM 2009: Formal Methods, Lecture Notes in Computer Science. Vol. 5850. Springer: Berlin/Heidelberg; 2009b. What can formal methods bring to systems biology? pp. 16–22.
-
- Bussmann LH, et al. A robust and highly efficient immune cell reprogramming system. Cell Stem Cell. 2009;5:554–566. - PubMed
Publication types
MeSH terms
Substances
Grants and funding
- 079249/WT_/Wellcome Trust/United Kingdom
- G0900729/1/NC3RS_/National Centre for the Replacement, Refinement and Reduction of Animals in Research/United Kingdom
- 12765/CRUK_/Cancer Research UK/United Kingdom
- 100140/WT_/Wellcome Trust/United Kingdom
- MC_PC_12009/MRC_/Medical Research Council/United Kingdom
LinkOut - more resources
Full Text Sources
Other Literature Sources
Medical

