Comparative Study
. 2013 Nov-Dec;20(6):1082-90.
doi: 10.1136/amiajnl-2012-001547. Epub 2013 Jun 27.

Three-dimensional morphological and signal intensity features for detection of intervertebral disc degeneration from magnetic resonance images

Affiliations
Comparative Study

Three-dimensional morphological and signal intensity features for detection of intervertebral disc degeneration from magnetic resonance images

A Neubert et al. J Am Med Inform Assoc. 2013 Nov-Dec.

Abstract

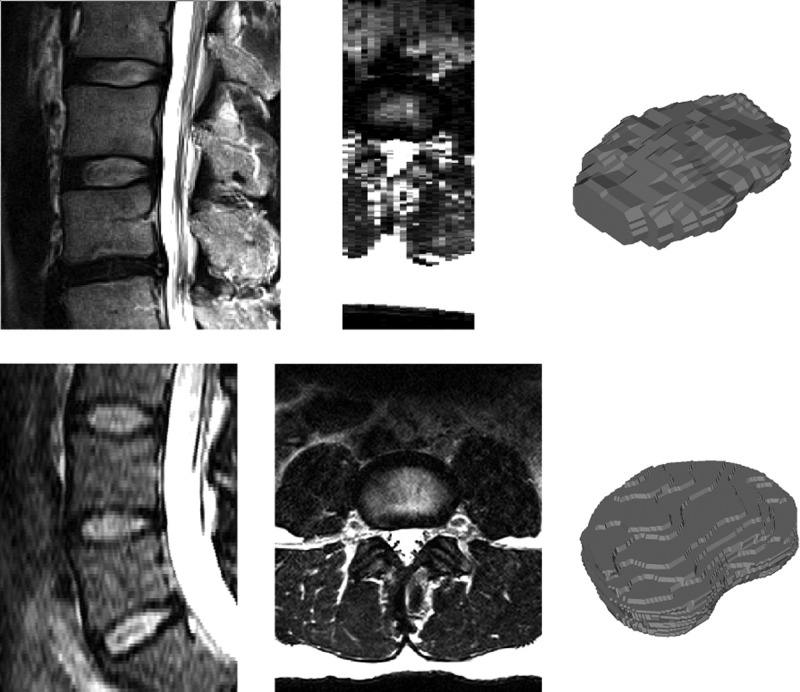
Background and objectives: Advances in MRI hardware and sequences are continually increasing the amount and complexity of data such as those generated in high-resolution three-dimensional (3D) scanning of the spine. Efficient informatics tools offer considerable opportunities for research and clinically based analyses of magnetic resonance studies. In this work, we present and validate a suite of informatics tools for automated detection of degenerative changes in lumbar intervertebral discs (IVD) from both 3D isotropic and routine two-dimensional (2D) clinical T2-weighted MRI.

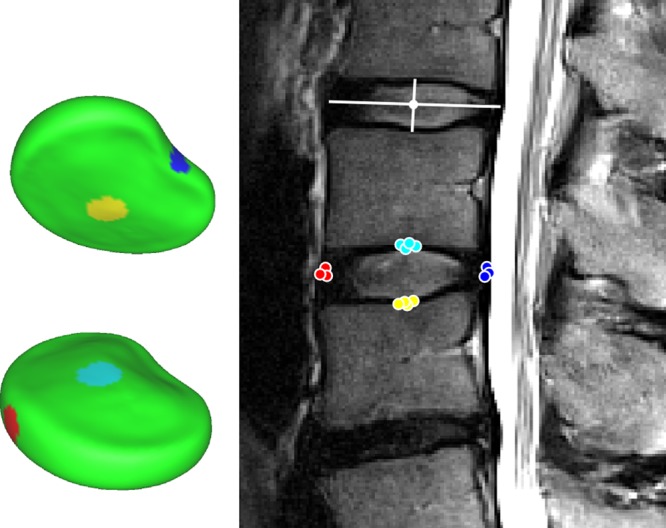
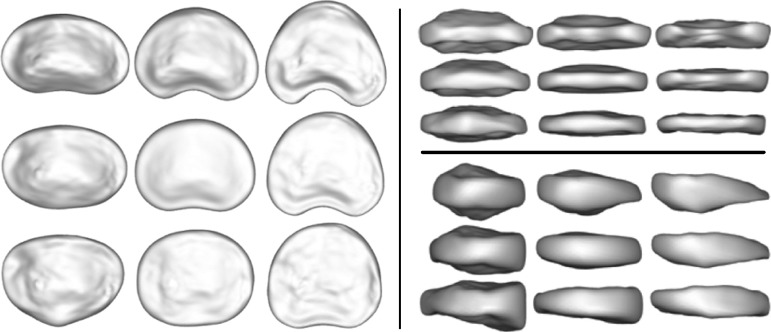
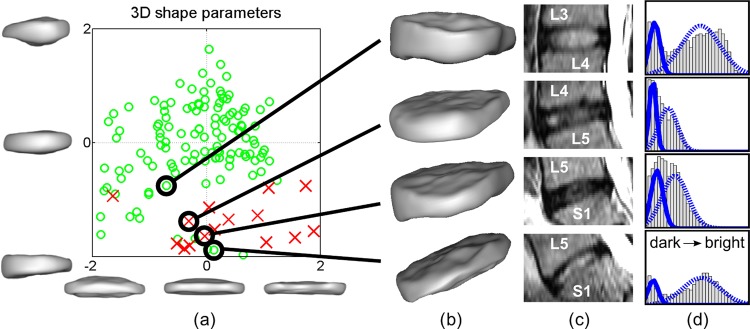
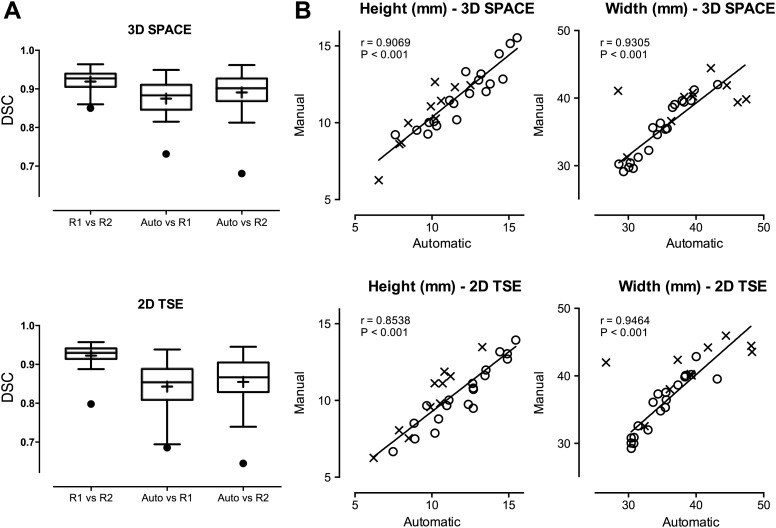
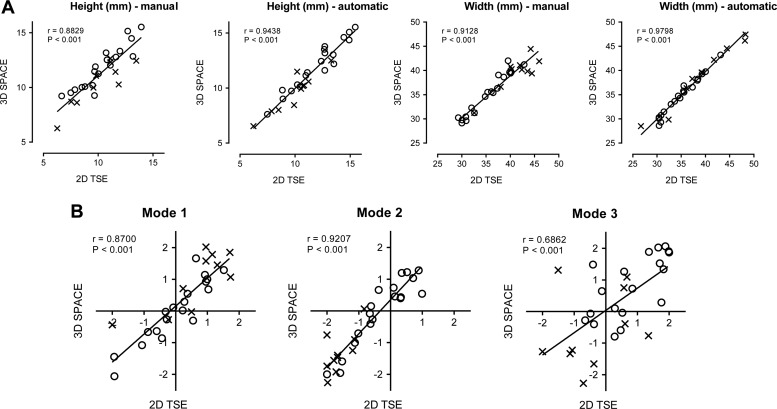
Materials and methods: An automated segmentation approach was used to extract morphological (traditional 2D radiological measures and novel 3D shape descriptors) and signal appearance (extracted from signal intensity histograms) features. The features were validated against manual reference, compared between 2D and 3D MRI scans and used for quantification and classification of IVD degeneration across magnetic resonance datasets containing IVD with early and advanced stages of degeneration.

Results and conclusions: Combination of the novel 3D-based shape and signal intensity features on 3D (area under receiver operating curve (AUC) 0.984) and 2D (AUC 0.988) magnetic resonance data deliver a significant improvement in automated classification of IVD degeneration, compared to the combination of previously used 2D radiological measurement and signal intensity features (AUC 0.976 and 0.983, respectively). Further work is required regarding the usefulness of 2D and 3D shape data in relation to clinical scores of lower back pain. The results reveal the potential of the proposed informatics system for computer-aided IVD diagnosis from MRI in large-scale research studies and as a possible adjunct for clinical diagnosis.

Keywords: Classification; Computer-aided diagnosis; Disc degeneration; Intervertebral discs; Morphology; Statistical shape models.


Figures

Figure 1
Figure 1
Sagittal (left) and axial (middle) views of an example 2D turbo spin echo (top, 3.3 mm slice spacing) and 3D SPACE (bottom, 1 mm slice spacing) MRI scans with manually segmented IVD shapes (right). The high resolution 3D image provides information about the anatomical shape that is not available in the sparser 2D scan. IVD, intervertebral disc; 2D, two dimensional; 3D, three dimensional.
Figure 2
Figure 2
Automated location and measurement of the IVD height and width was done using the statistical shape model with four areas of interest. Points from the areas of the segmented IVD are projected to the mid-sagittal slice and the minimal distance between superior–inferior and anterior–posterior clouds are used as IVD height and width, respectively. Example manual measurements are illustrated by white lines. IVD, intervertebral disc. Access the article online to view this figure in colour.
Figure 3
Figure 3
The statistical shape model of lumbar IVD extracted from the 3D SPACE MRI scans. The mean shape (middle of each panel) and shapes generated at ± 3 SD are shown (left, superior view; top right, posterior view; bottom right, side view) for the first (abscissa axis) and second (ordinate axis) modes of variation. Both modes are associated with relative disc thinning, the second mode includes further information on anterior–posterior wedging of the disc. IVD, intervertebral disc; 3D. three dimensional.
Figure 4
Figure 4
Projection of dataset 1 onto the first two modes of variation (±2 SD) is shown in (A). Most of the abnormal discs (red crosses) are located in the bottom right area, describing IVD narrowing (as can be seen in figure 3). Four individual example IVD automatic segmentations are shown in (B), corresponding MRI in panel (C) and the corresponding histograms with fitted distributions in (D). A progressive IVD space narrowing can be observed in (B) from top to bottom, which is reflected by the spatial relationship of the corresponding points in (A). The nucleus pulposus signal intensity is lower in the middle two IVD, as seen in (C), resulting in a compressed ‘single’ intensity peak in the histograms (D) demonstrating two close and overlapping Gaussian distributions. IVD, intervertebral disc; 3D, three dimensional. Access the article online to view this figure in colour.
Figure 5
Figure 5
DSC scores for inter-rater variability and accuracy of the automated segmentation algorithm evaluated on 29 IVD (R1, rater 1; R2, rater 2; Auto, automatic segmentation) are presented in (A). (B) Presents correlations of extracted IVD heights and widths (a healthy IVD is marked with a circle, abnormal with a cross). One outlier in IVD width assessment (top left cross) was removed from linear regression fitting and Spearman's r computation for IVD widths. This case presented particular anterior bulge and posterior herniation combined with adjacent vertebral body degeneration and challenged both manual and automatic assessment (the outlier marked in DSC box plots). DSC, dice similarity coefficient; IVD, intervertebral disc; 2D, two dimensional; 3D, three dimensional; TSE, turbo spin echo.
Figure 6
Figure 6
Reproducibility of the morphological features (2D measurements in (A), 3D modes of variation in (B) between 2D and 3D MRI scans (a healthy IVD is marked with a circle, abnormal with a cross) with Spearman's rank correlation coefficient r. IVD, intervertebral disc; 2D, two dimensional; 3D, three dimensional; TSE, turbo spin echol.

References

    1. Woolf AD, Pfleger B. Burden of major musculoskeletal conditions. Bull WHO 2003;81:646–56 - PMC - PubMed
    1. Cousins JP, Haughton VM. Magnetic resonance imaging of the spine. J Am Acad Orthop Surg 2009;17:22–30 - PubMed
    1. National Institute of Neurological Disorder and Stroke (NINDS) Low back pain fact sheet, 2008
    1. Van Ginneken B, Schaefer-Prokop CM, Prokop M. Computer-aided diagnosis: how to move from the laboratory to the clinic. Radiology 2011;261:719–32 - PubMed
    1. Modic MT, Ross JS. Lumbar degenerative disk disease. Radiology 2007;245:43–61 - PubMed

Publication types

MeSH terms