. 2013 Aug 8;122(6):958-68.
doi: 10.1182/blood-2013-01-482026. Epub 2013 Jun 27.

Integrated phosphoproteomic and metabolomic profiling reveals NPM-ALK-mediated phosphorylation of PKM2 and metabolic reprogramming in anaplastic large cell lymphoma

Affiliations

Integrated phosphoproteomic and metabolomic profiling reveals NPM-ALK-mediated phosphorylation of PKM2 and metabolic reprogramming in anaplastic large cell lymphoma

Scott R P McDonnell et al. Blood. .

Abstract

The mechanisms underlying the pathogenesis of the constitutively active tyrosine kinase nucleophosmin-anaplastic lymphoma kinase (NPM-ALK) expressing anaplastic large cell lymphoma are not completely understood. Here we show using an integrated phosphoproteomic and metabolomic strategy that NPM-ALK induces a metabolic shift toward aerobic glycolysis, increased lactate production, and biomass production. The metabolic shift is mediated through the anaplastic lymphoma kinase (ALK) phosphorylation of the tumor-specific isoform of pyruvate kinase (PKM2) at Y105, resulting in decreased enzymatic activity. Small molecule activation of PKM2 or expression of Y105F PKM2 mutant leads to reversal of the metabolic switch with increased oxidative phosphorylation and reduced lactate production coincident with increased cell death, decreased colony formation, and reduced tumor growth in an in vivo xenograft model. This study provides comprehensive profiling of the phosphoproteomic and metabolomic consequences of NPM-ALK expression and reveals a novel role of ALK in the regulation of multiple components of cellular metabolism. Our studies show that PKM2 is a novel substrate of ALK and plays a critical role in mediating the metabolic shift toward biomass production and tumorigenesis.


Figures
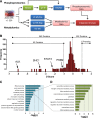
Figure 1
Figure 1
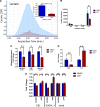
Phosphoproteomic analysis reveals NPM-ALK–mediated changes in metabolic pathways. (A) Experimental strategy used for phosphoproteomic and metabolomic analysis of ALK. NPM-ALK+ cell lines were exposed to ALK inhibitor or DMSO. Phosphorylated peptides were enriched with metal oxide affinity chromatography (MOAC) followed by immunoprecipitation with pY antibodies and subjected to tandem MS analysis (biological triplicate). For the metabolomics, the cell lysates were subjected to LC-MS in both positive and negative mode, as well as gas chromatography MS (GC-MS). (B) The phosphoproteomic data plotted as number of proteins (frequency) vs the z-score based on change in spectral counts in response to ALK inhibition (CEP). A significance threshold was set at |z|≥ 1. (C) GO term enrichment analysis using Database for Annotation, Visualization and Integrated Discovery applied to the proteins that changed in spectral counts following ALK inhibiton. A subset of the significant terms is displayed and ranked by –log(p), the natural log of the P value. (D) List of GO terms that comprise the metabolic processes term.
Figure 2
Figure 2
Metabolomic analysis reveals widespread metabolic changes driven by NPM-ALK signaling. (A) Unsupervised hierarchical clustering of all identified mass spectral features in DMSO- and CEP-treated cells (D1-D4 are DMSO samples; C1-C4 are CEP samples). (B) Supervised hierarchical clustering of those mass spectral features that changed significantly (P < .05) based on CEP treatment. (C) MetaboAnalyst 2.0–generated pathways that changed in response to ALK inhibition. *P < .05, **P < .01.
Figure 3
Figure 3
Integrated “omic” analysis reveals global metabolic changes. Kyoto Encyclopedia of Genes and Genomes “search&color pathway” analysis for phosphoproteins and metabolites overlaid on the human metabolic reference map (hsa01100). Phosphoproteomic data from one biological replicate of the SU-DHL-1 were used, whereas metabolomic data from 4 averaged biological replicates of SU-DHL-1 cells were used. Metabolites that changed (Student t test, P < .05) in response to CEP treatment were used. Green and red represent decrease and increase, respectively. Lines represent phosphoprotein and dots represent metabolites. Blue shading over glycolysis, TCA cycle, and nucleotide metabolism serve to highlight pathways that are highly represented.
Figure 4
Figure 4
Metabolic flux analysis reveals NPM-ALK–driven shift toward biomass production. (A) Quantitation of lactate levels by metabolomic analysis. Representative spectra for DMSO- (blue) and CEP- (red) treated cells. The quantitation of lactate based on 4 replicates is shown in the inset. (B) Metabolic flux analysis of lactate in SU-DHL-1 cell following 300 nM CEP treatment. All species of labeled lactate are shown. m, mass. (C) Flux analysis for fully labeled glucose 6-phosphate/fructose 6-phosphate (G6P/F6P), fructose bisphosphate (FBP), and ribose 5-phosphate/xylose 5-phosphate (R5P/X5P) are shown in the presence of DMSO or ALK inhibitor. (D) Total pool abundance (all labeled and unlabeled species combined) for ADP and ATP in the presence of DMSO or ALK inhibitor. (E) Biochemical assays for lactate and ATP after 300 nM CEP for 6 hours. Data are normalized by cell number. Mean ± SD; *P < .05, **P < .01.
Figure 5
Figure 5
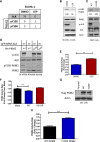
NPM-ALK regulates the phosphorylation and activity of PKM2. (A) Changes in p-ALK and p-PKM2 in response to ALK inhibition. The spectral counts for ALK (all phosphorylated peptides) and the 2 identified PKM2 phosphopeptides are shown. (B) Immunoblots of lysates from SU-DHL-1 cells following CEP treatment of 6 hours at 300 nM CEP. (C) Immunoblots of 293T lysates that were transiently transfected with either WT NPM-ALK or K210R NPM-ALK. (D) In vitro kinase assay with purified His-PKM2 (WT, Y105F, or Y390F) and ALK immunoprecipitation using GFP-NPM-ALK (WT or K210R). (E) PKM2 activity assay for SUPM2 cells treated with 100 nM CEP for 4 hours. (F) PKM2 activity assay on lysates from 293T cells transfected with mock, WT NPM-ALK, or K210R NPM-ALK. (G) Stable expression of Flag-PKM2 in DEL cells. (H) PKM2 activity assay of DEL cells stably expressing WT or Y105F PKM2. Data are mean ± SD; **P < .01.
Figure 6
Figure 6
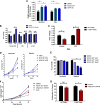
PKM2 regulates metabolic switch and proliferation. (A) PKM2 activity assay using SU-DHL-1 treated with 10 μM NCGC-527 for 24 hours. (B) Lactate and ATP assays using conditioned media and cell lysates (respectively) on Karpas299, DEL, and Jurkat cells following 6-hour treatment with 30 μM NCGC-527. (C) Lactate and ATP assays of DEL cells stably expressing Flag-PKM2 WT of Flag-PKM2 Y105F. (D) Cellular proliferation measured by serial counting with Trypan blue stain of DEL cells treated with indicated concentrations of NCGC-527. Cells were maintained in either normoxic or hypoxic (3% O2) conditions. (E) Viability data from D showing the percentage live cells under the indicated conditions. (F) Cell proliferation of DEL cells treated with NCGC-527, oligomycin, or both. (G) Cell proliferation of DEL cells stably expressing Flag-PKM2 and treated with DMSO or 500 nM oligomycin for 72 hours. Counts were normalized to each control (DMSO) condition. Data are mean ± SD; *P < .05, **P < .01, not significant (NS).
Figure 7
Figure 7
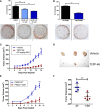
PKM2 regulates ALCL tumorigenesis. Methylcellulose colony formation assay using (A) DEL cells treated with 10 and 30 μM NCGC-527 and (B) DEL cells stably expressing Flag-PKM2 WT and Y105F. Samples analyzed in triplicate, with a representative image shown below each bar. Data are mean ± SD. (C) Tumor volumes of DEL xenograft tumors treated with vehicle (0.5% methylcellulose + 0.1% Tween 80) or TEPP-46 (50 mg/kg) twice a day by oral dose from day of tumor implantation (mean ± SEM) (n = 7). (D) Representative images of tumors at day 14. (E) Tumor volumes of xenografted DEL cells stably expressing WT or Y105F-PKM2 (mean ± SEM; n = 5). (F) Scatterplot of day 10 tumor volumes. Data are mean ± 95% confidence interval; *P < .05, **P < .01.

References

    1. Amin HM, Lai R. Pathobiology of ALK+ anaplastic large-cell lymphoma. Blood. 2007;110(7):2259–2267. - PMC - PubMed
    1. Bischof D, Pulford K, Mason DY, Morris SW. Role of the nucleophosmin (NPM) portion of the non-Hodgkin’s lymphoma-associated NPM-anaplastic lymphoma kinase fusion protein in oncogenesis. Mol Cell Biol. 1997;17(4):2312–2325. - PMC - PubMed
    1. Soda M, Choi YL, Enomoto M, et al. Identification of the transforming EML4-ALK fusion gene in non-small-cell lung cancer. Nature. 2007;448(7153):561–566. - PubMed
    1. Janoueix-Lerosey I, Lequin D, Brugières L, et al. Somatic and germline activating mutations of the ALK kinase receptor in neuroblastoma. Nature. 2008;455(7215):967–970. - PubMed
    1. Griffin CA, Hawkins AL, Dvorak C, Henkle C, Ellingham T, Perlman EJ. Recurrent involvement of 2p23 in inflammatory myofibroblastic tumors. Cancer Res. 1999;59(12):2776–2780. - PubMed

Publication types