. 2013 Jul;15(7):749-60.
doi: 10.1593/neo.121956.

Loss of Sh3gl2/endophilin A1 is a common event in urothelial carcinoma that promotes malignant behavior

Affiliations

Loss of Sh3gl2/endophilin A1 is a common event in urothelial carcinoma that promotes malignant behavior

Shyama Majumdar et al. Neoplasia. 2013 Jul.

Abstract

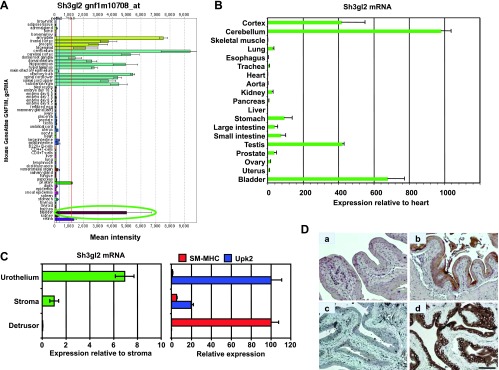
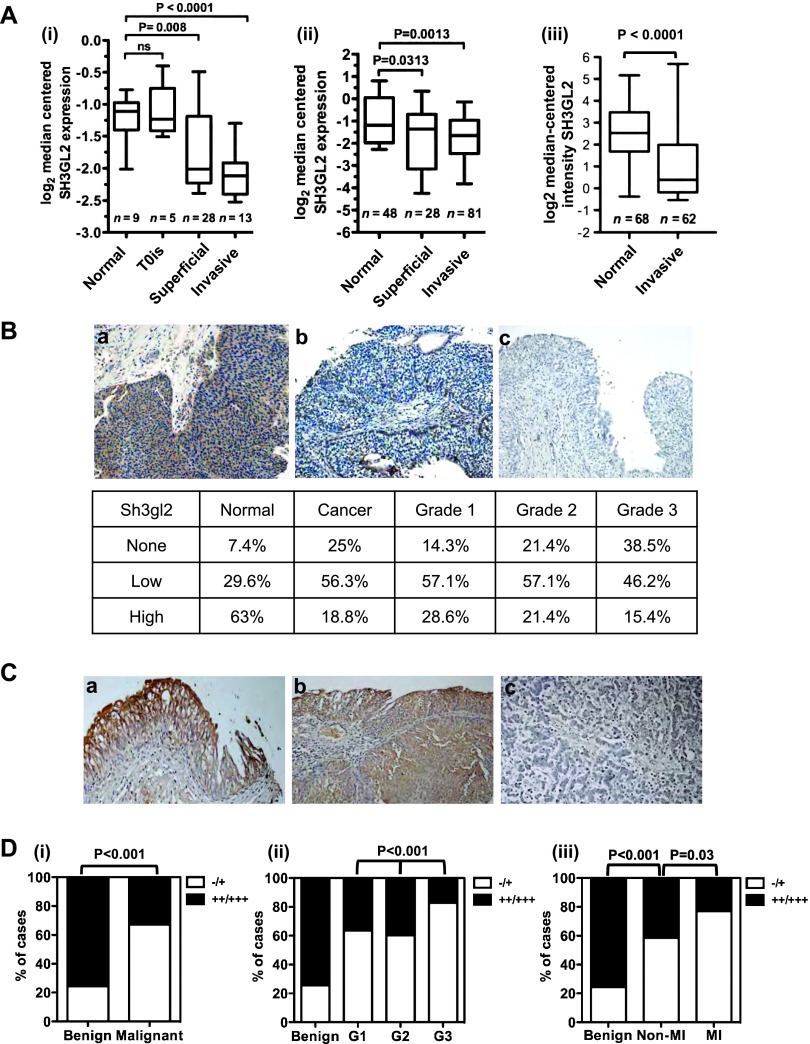
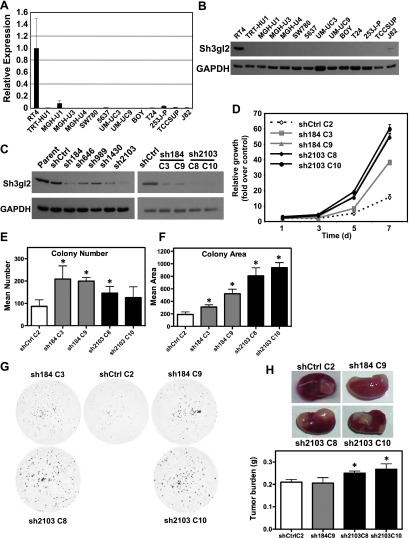
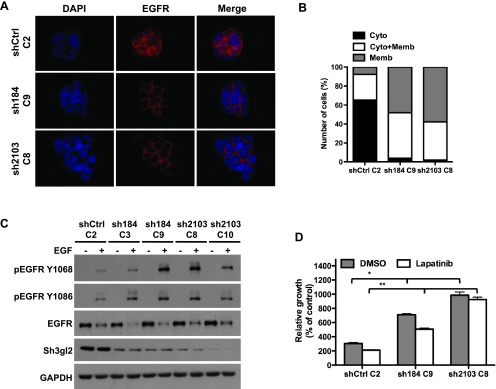
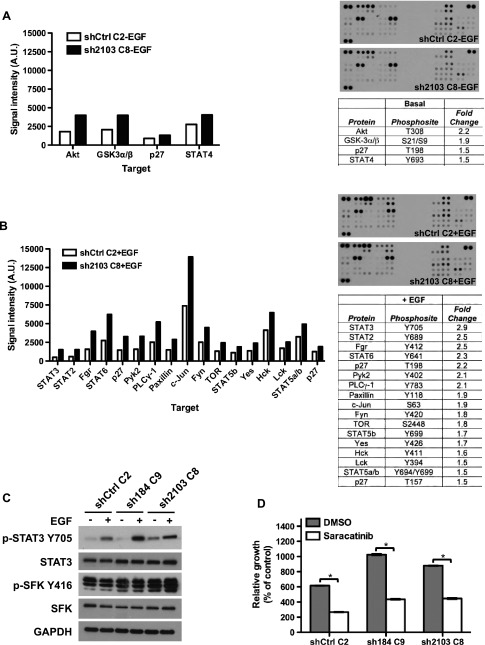
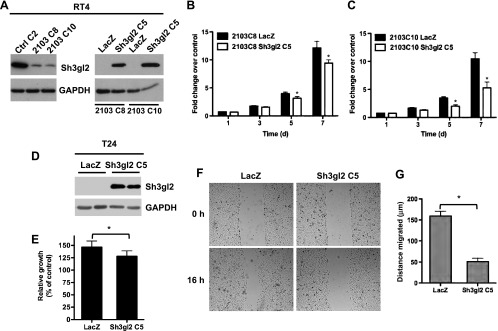
Urothelial carcinoma (UC) causes substantial morbidity and mortality worldwide. However, the molecular mechanisms underlying urothelial cancer development and tumor progression are still largely unknown. Using informatics analysis, we identified Sh3gl2 (endophilin A1) as a bladder urothelium-enriched transcript. The gene encoding Sh3gl2 is located on chromosome 9p, a region frequently altered in UC. Sh3gl2 is known to regulate endocytosis of receptor tyrosine kinases implicated in oncogenesis, such as the epidermal growth factor receptor (EGFR) and c-Met. However, its role in UC pathogenesis is unknown. Informatics analysis of expression profiles as well as immunohistochemical staining of tissue microarrays revealed Sh3gl2 expression to be decreased in UC specimens compared to nontumor tissues. Loss of Sh3gl2 was associated with increasing tumor grade and with muscle invasion, which is a reliable predictor of metastatic disease and cancer-derived mortality. Sh3gl2 expression was undetectable in 19 of 20 human UC cell lines but preserved in the low-grade cell line RT4. Stable silencing of Sh3gl2 in RT4 cells by RNA interference 1) enhanced proliferation and colony formation in vitro, 2) inhibited EGF-induced EGFR internalization and increased EGFR activation, 3) stimulated phosphorylation of Src family kinases and STAT3, and 4) promoted growth of RT4 xenografts in subrenal capsule tissue recombination experiments. Conversely, forced re-expression of Sh3gl2 in T24 cells and silenced RT4 clones attenuated oncogenic behaviors, including growth and migration. Together, these findings identify loss of Sh3gl2 as a frequent event in UC development that promotes disease progression.


Figures

Figure 1
Figure 1
Identification of Sh3gl2 as a transcript that is highly enriched in the bladder urothelium. (A) SymAtlas screenshot of microarray hybridization analysis for Sh3gl2 in mouse organs illustrating high signal intensity in tissues from the nervous system, as well as the bladder (circled in green). (B) Semiquantitative real-time RT-PCR analysis of selected mouse tissues verified enrichment of Sh3gl2 mRNA in the nervous system tissue and bladder. Data are presented as expression level relative to that in heart (following normalization to GAPDH), which is assigned a value of 1, and represent mean ± SD of triplicate values. (C) cDNAs prepared from urothelium, stroma, and detrusor smooth muscle tissue microdissected from mouse bladders were analyzed for expression of Sh3gl2 as well as the urothelial marker uroplakin 2 and the smooth muscle marker smooth muscle myosin heavy chain by semiquantitative real-time RT-PCR. As shown in the left panel, Sh3gl2 was expressed predominantly in the urothelium, with minimal mRNA detectable in stroma or detrusor smooth muscle. Effective separation of urothelial, stromal, and smooth muscle tissue by laser capture microdissection was demonstrated by restricted expression of uroplakin 2 and smooth muscle myosin heavy chain to urothelial and smooth muscle tissues, respectively (right panel). (D) IHC staining of mouse bladder tissue revealed Sh3gl2 expression to be restricted to the urothelium (b, d), with no signal evident in submucosa or muscle. Preincubation of primary antibody with blocking peptide eliminated signal completely (c), confirming antibody specificity. No background signal was detected in sections receiving secondary antibody only (a). Scale bar, 100 µm.
Figure 2
Figure 2
Sh3gl2 loss in bladder cancer correlates with tumor progression. (A) Analysis of three independent cohorts of bladder cancer specimens (i–iii) using the Oncomine database revealed decreased Sh3gl2 mRNA levels in both superficial and invasive lesions compared to normal bladder tissue. (B) IHC analysis of a bladder cancer tissue microarray (TMA) revealed a marked decrease in Sh3gl2 expression in cancer tissues versus noncancerous tissues, as well as a trend toward decreased expression in high-grade versus low-grade cancers. Representative images of Sh3gl2 staining in low- and high-grade lesions are presented in a and b; c represents the control receiving no primary antibody. Original magnification, x200. (C) Representative staining of (a) benign, (b) low-grade, and (c) high-grade lesions on a bladder cancer progression TMA. Original magnification, x200. (D) Quantification of IHC staining of a bladder cancer progression array revealed frequent and progressive loss of Sh3gl2. Graphs show the proportion of tissue specimens (%) in each subgroup with low (-/+) versus high (++/+++) intensity staining for Sh3gl2 protein. Sh3gl2 staining intensity was significantly lower in (i) malignant versus benign specimens (P < .001), (ii) in high-grade (G3) versus low-grade (G1/G2) specimens (P < .001), and (iii) in muscle-invasive versus non-muscle-invasive specimens (P = .03), as well as non-muscle-invasive versus benign specimens (P <.001).
Figure 3
Figure 3
Sh3gl2 is lost with high frequency in bladder cancer cell lines and regulates cell growth in vitro and in vivo. Sh3gl2 mRNA (A) and protein (B) levels were analyzed in a panel of 20 bladder epithelial cell lines by semiquantitative real-time RT-PCR or immunoblot analysis, respectively; data from 14 cell lines are presented. Only the low-grade papilloma-derived cell line RT4 expressed detectable levels of Sh3gl2. (C) RT4 cells infected with lentivirus encoding shRNAs directed against five distinct regions of the Sh3gl2 transcript (sh184, sh646, sh989, sh1430, and sh2103) or with nontargeting control shRNA (shCtrl) were analyzed for Sh3gl2 expression by immunoblot analysis with two independent anti-Sh3gl2 antibodies and identified sh184 and sh2103 as yielding efficient knockdown of Sh3gl2 (left panel). Single-cell clones isolated from shCtrl (C2), sh184 (C3 and C9), and sh2103 (C8 and C10) were selected as candidate clones for functional analysis (right panel). (D) Proliferation of Sh3gl2-silenced cells, as determined in a biomass assay, was increased in all four clones compared to RT4 control cells at all time points tested (P < .05). Data are representative of at least three independent experiments. Control and Sh3gl2-targeted clones seeded at clonal density were evaluated for (E) colony number and (F) colony area 14 days after seeding. Loss of Sh3gl2 significantly increased cell survival (number) in three of four clones (*P < .01) and proliferation (area) in all four Sh3gl2-silenced clones compared to controls (*P < .01). (G) Representative images of clonal growth assays for four Sh3gl2-silenced clones and the control clone. (H) Tissue recombinants comprising RT4 cells stably silenced with control or Sh3gl2-targeted shRNA combined with rat fetal bladder mesenchyme were implanted under the renal capsule of severe combined immunodeficient mice and harvested 3 weeks after implantation. Representative images indicating grafts in situ are indicated. The graph indicates wet weight of grafts generated from three to four grafts per indicated clone and data are presented as means ± SD.
Figure 4
Figure 4
Stable Sh3gl2 silencing attenuates EGFR internalization and enhances receptor activation. (A) Control and Sh3gl2-silenced RT4 cells were seeded on coverslips, serum-depleted for 24 hours, and treated without or with 10 nM EGF for 10 minutes at 37°C. Localization of the EGFR was visualized by indirect immunofluorescence staining. Nuclei are counterstained with 4′, 6-diamidino-2-phenylindole (DAPI). Data are representative of three independent trials. Original magnification, x63. (B) The extent of EGFR internalization under the conditions indicated in A was quantified and plotted as the percentage of cells showing EGFR that was localized predominantly on the membrane (Memb), predominantly in the cytoplasm (Cyto), or present both in the cytoplasm and on the membrane (Cyto + Memb). (C) Serum-depleted control and Sh3gl2-silenced RT4 cells were treated with 10 nM EGF for 10 minutes at 37°C, and whole-cell lysates were prepared for evaluation of receptor phosphorylation. Increased EGFR phosphorylation was evident in all four clones in which Sh3gl2 was silenced compared to nontargeted control cells. Data are representative of at least four independent experiments. (D) Control and Sh3gl2-silenced RT4 cells were treated with vehicle (DMSO) or 0.3 µM lapatinib for 5 days and cell number determined by biomass assay. Data represent absorbance on day 5 expressed as a percentage of absorbance on day 0 and are the means ± SD of four values. *, shCtrl C2 DMSO versus sh184 C9 DMSO or sh2103 C8 DMSO; **, shCtrl C2 lapatinib versus sh184 C9 lapatinib or sh2103 C8 lapatinib. Data are representative of at least two independent experiments.
Figure 5
Figure 5
Stable Sh3gl2 silencing increases phosphorylation of SFKs and STAT3. Lysates of control and Sh3gl2-silenced cells treated without (A) or with (B) 10 nM EGF for 10 minutes were analyzed using a phospho-kinase proteome array. Graphs and tables indicate phospho-proteins that were altered by >1.5-fold in response to Sh3gl2 silencing. Representative images of phospho-array blots from each condition are shown. (C) Independent lysates immunoblotted with the indicated antibodies revealed enhanced phosphorylation of SFKs at Y416 (or corresponding conserved residue) and STAT3 at Y705. (D) Control and Sh3gl2-silenced RT4 cells were treated with vehicle (DMSO) or 0.125 µM saracatinib for 5 days and cell number determined by biomass assay. Graphs illustrate absorbance on day 5 expressed as a percentage of absorbance on day 0, and data are the means ± SD of two values for DMSO and six values for saracatinib. Data are representative of at least two independent trials. *P < .05 compared to DMSO-treated condition.
Figure 6
Figure 6
Restoration of Sh3gl2 expression inhibits proliferation and migration. (A) Rescue of Sh3gl2 expression in RT4 cells using Sh3gl2-expressing lentivirus was verified by immunoblot analysis. (B, C) Re-expression attenuated proliferation in two independent clones silenced for Sh3gl2, compared to cells expressing an irrelevant gene, LacZ. *P < .05 compared to LacZ at corresponding time point. (D) Reconstitution of Sh3gl2 expression in T24 cells was confirmed by immunoblot analysis. (E) Restoration of Sh3gl2 expression inhibited proliferation, as measured at 48 hours after seeding. *P < .05 compared to proliferation in LacZ-expressing cells. (F) Restoration of Sh3gl2 expression inhibited EGF-stimulated migration in T24 cells. (G) The graph represents average distance migrated, and data are presented as means ± SD. *P < .05 compared to distance migrated in LacZ-expressing cells.

References

    1. Jemal A, Siegel R, Xu J, Ward E. Cancer statistics, 2010. CA Cancer J Clin. 2010;60:277–300. - PubMed
    1. Riley GF, Potosky AL, Lubitz JD, Kessler LG. Medicare payments from diagnosis to death for elderly cancer patients by stage at diagnosis. Med Care. 1995;33:828–841. - PubMed
    1. Sievert KD, Amend B, Nagele U, Schilling D, Bedke J, Horstmann M, Hennenlotter J, Kruck S, Stenzl A. Economic aspects of bladder cancer: what are the benefits and costs? World J Urol. 2009;27:295–300. - PMC - PubMed
    1. Degraff DJ, Cates JM, Mauney JR, Clark PE, Matusik RJ, Adam RM. When urothelial differentiation pathways go wrong: implications for bladder cancer development and progression. Urol Oncol. 2011 - PMC - PubMed
    1. Knowles MA, Platt FM, Ross RL, Hurst CD. Phosphatidylinositol 3-kinase (PI3K) pathway activation in bladder cancer. Cancer Metastasis Rev. 2009;28:305–316. - PMC - PubMed

Publication types

MeSH terms