

Robust PCA based method for discovering differentially expressed genes
- PMID: 23815087
- PMCID: PMC3654929
- DOI: 10.1186/1471-2105-14-S8-S3
Robust PCA based method for discovering differentially expressed genes
Abstract
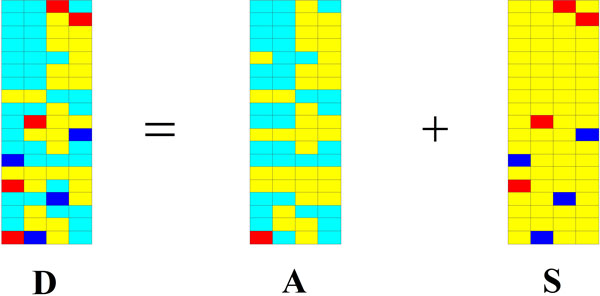
How to identify a set of genes that are relevant to a key biological process is an important issue in current molecular biology. In this paper, we propose a novel method to discover differentially expressed genes based on robust principal component analysis (RPCA). In our method, we treat the differentially and non-differentially expressed genes as perturbation signals S and low-rank matrix A, respectively. Perturbation signals S can be recovered from the gene expression data by using RPCA. To discover the differentially expressed genes associated with special biological progresses or functions, the scheme is given as follows. Firstly, the matrix D of expression data is decomposed into two adding matrices A and S by using RPCA. Secondly, the differentially expressed genes are identified based on matrix S. Finally, the differentially expressed genes are evaluated by the tools based on Gene Ontology. A larger number of experiments on hypothetical and real gene expression data are also provided and the experimental results show that our method is efficient and effective.
Figures
Similar articles
-
A P-Norm Robust Feature Extraction Method for Identifying Differentially Expressed Genes.PLoS One. 2015 Jul 22;10(7):e0133124. doi: 10.1371/journal.pone.0133124. eCollection 2015. PLoS One. 2015. PMID: 26201006 Free PMC article.
-
Robust Principal Component Analysis Regularized by Truncated Nuclear Norm for Identifying Differentially Expressed Genes.IEEE Trans Nanobioscience. 2017 Sep;16(6):447-454. doi: 10.1109/TNB.2017.2723439. Epub 2017 Jul 4. IEEE Trans Nanobioscience. 2017. PMID: 28692983
-
Block-Constraint Robust Principal Component Analysis and its Application to Integrated Analysis of TCGA Data.IEEE Trans Nanobioscience. 2016 Sep;15(6):510-516. doi: 10.1109/TNB.2016.2574923. Epub 2016 Jun 8. IEEE Trans Nanobioscience. 2016. PMID: 27295679
-
RPCA-Based Tumor Classification Using Gene Expression Data.IEEE/ACM Trans Comput Biol Bioinform. 2015 Jul-Aug;12(4):964-70. doi: 10.1109/TCBB.2014.2383375. IEEE/ACM Trans Comput Biol Bioinform. 2015. PMID: 26357336
-
Principal components analysis based methodology to identify differentially expressed genes in time-course microarray data.BMC Bioinformatics. 2008 Jun 6;9:267. doi: 10.1186/1471-2105-9-267. BMC Bioinformatics. 2008. PMID: 18534040 Free PMC article.
Cited by
-
Joint Lp-Norm and L2,1-Norm Constrained Graph Laplacian PCA for Robust Tumor Sample Clustering and Gene Network Module Discovery.Front Genet. 2021 Feb 23;12:621317. doi: 10.3389/fgene.2021.621317. eCollection 2021. Front Genet. 2021. PMID: 33708239 Free PMC article.
-
Gene Feature Extraction Based on Nonnegative Dual Graph Regularized Latent Low-Rank Representation.Biomed Res Int. 2017;2017:1096028. doi: 10.1155/2017/1096028. Epub 2017 Mar 30. Biomed Res Int. 2017. PMID: 28466003 Free PMC article.
-
A P-Norm Robust Feature Extraction Method for Identifying Differentially Expressed Genes.PLoS One. 2015 Jul 22;10(7):e0133124. doi: 10.1371/journal.pone.0133124. eCollection 2015. PLoS One. 2015. PMID: 26201006 Free PMC article.
-
An Integrated Approach for Identifying Molecular Subtypes in Human Colon Cancer Using Gene Expression Data.Genes (Basel). 2018 Aug 2;9(8):397. doi: 10.3390/genes9080397. Genes (Basel). 2018. PMID: 30072645 Free PMC article.
-
Consistent metagenomic biomarker detection via robust PCA.Biol Direct. 2017 Jan 31;12(1):4. doi: 10.1186/s13062-017-0175-4. Biol Direct. 2017. PMID: 28143486 Free PMC article.
References
-
- Huang DS, Zhao XM, Huang GB, Cheung YM. Classifying protein sequences using hydropathy blocks. Pattern recognition. 2006;39(12):2293–2300. doi: 10.1016/j.patcog.2005.11.012. - DOI
Publication types
MeSH terms
LinkOut - more resources
Full Text Sources
Other Literature Sources
