

Retinoic acid and α-galactosylceramide regulate the expression of costimulatory receptors and transcription factors responsible for B cell activation and differentiation
- PMID: 23816303
- PMCID: PMC4063359
- DOI: 10.1016/j.imbio.2013.05.003
Retinoic acid and α-galactosylceramide regulate the expression of costimulatory receptors and transcription factors responsible for B cell activation and differentiation
Abstract
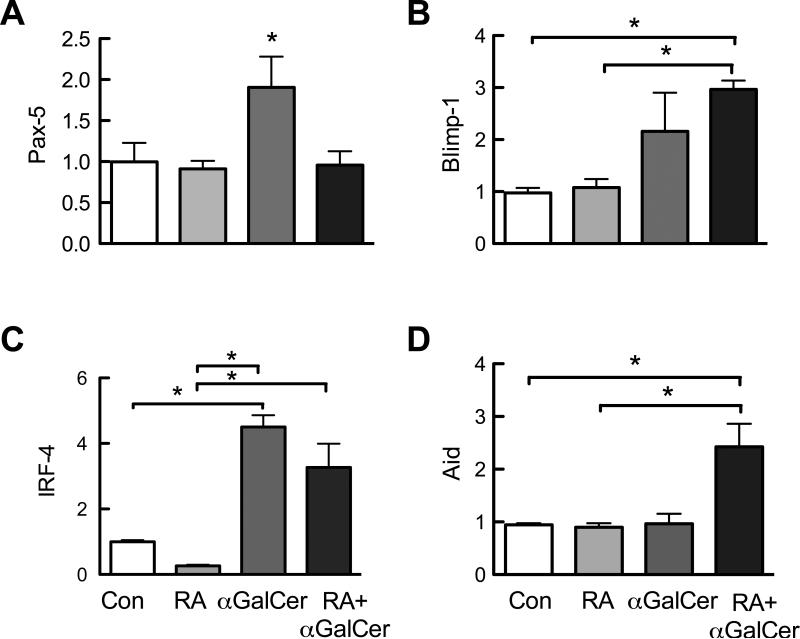
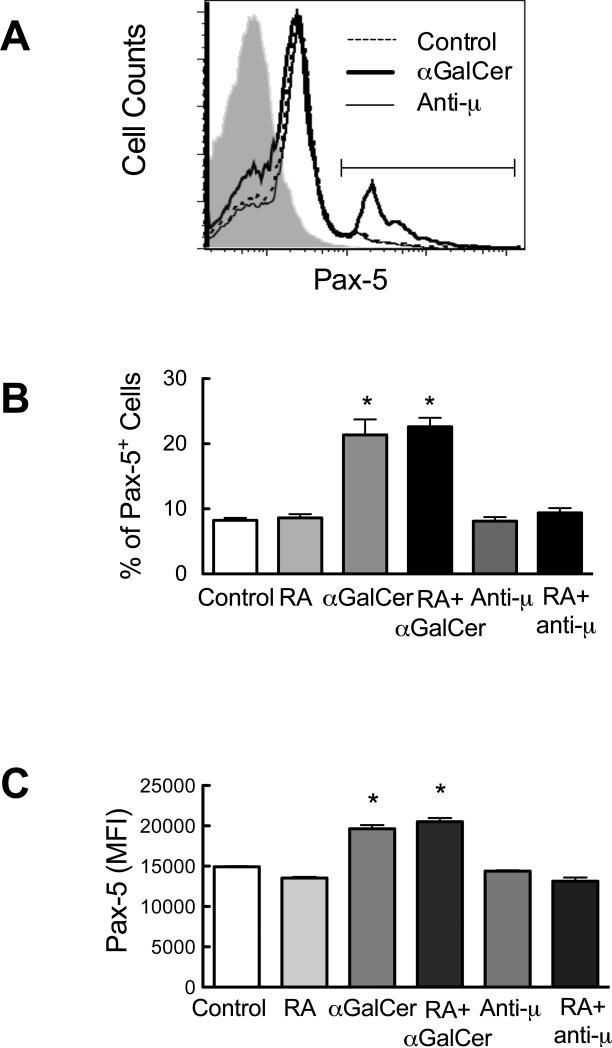
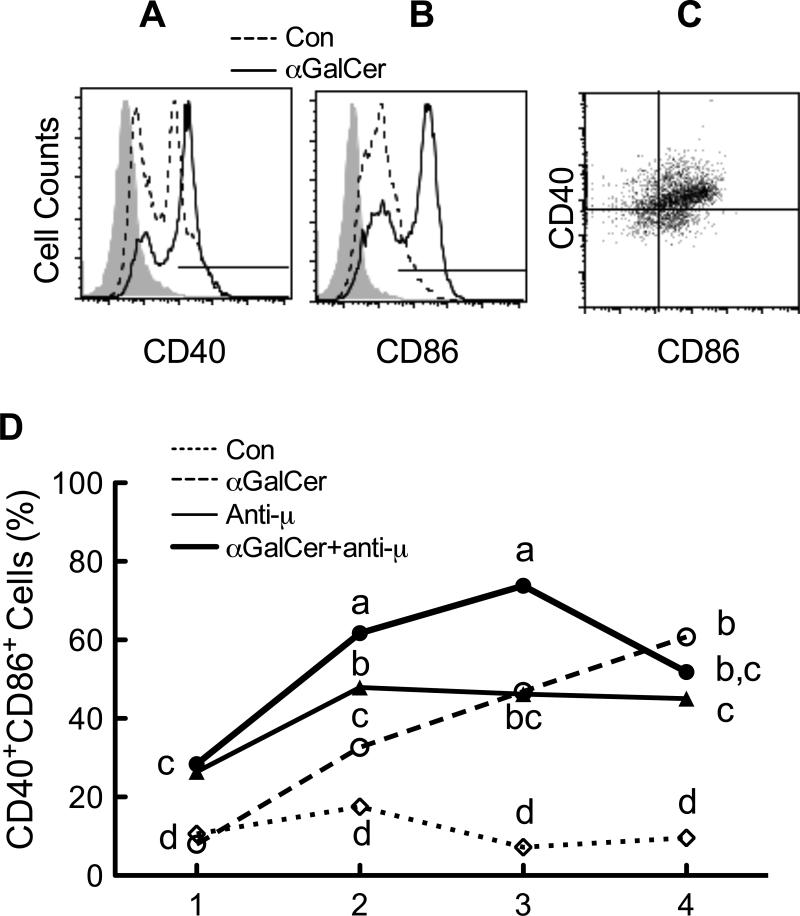
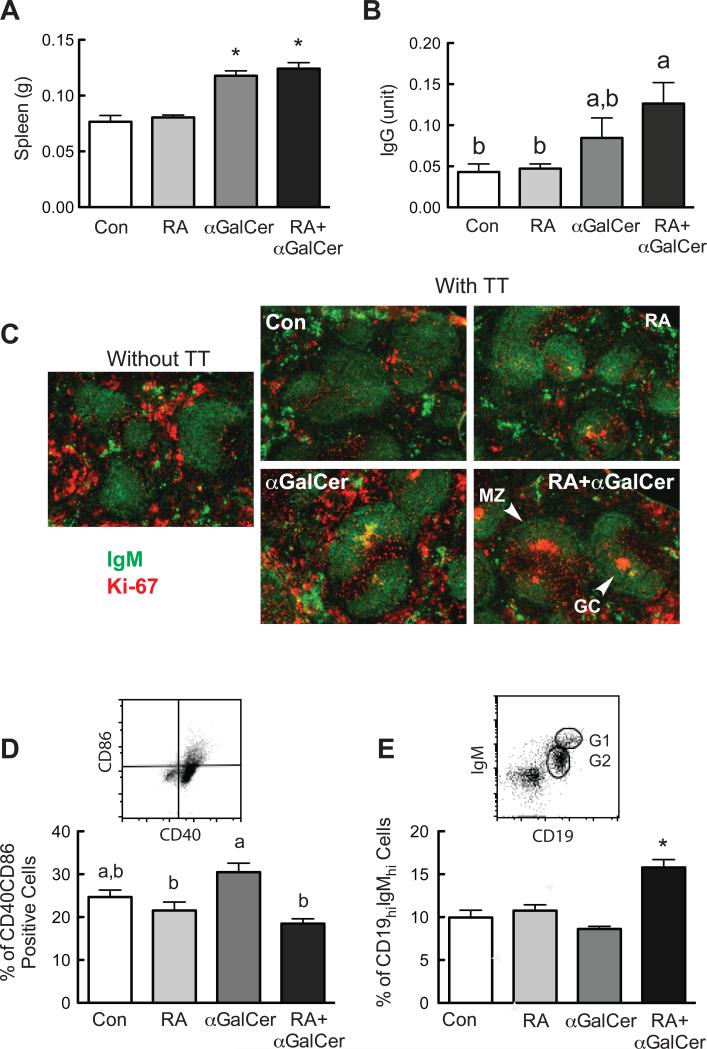
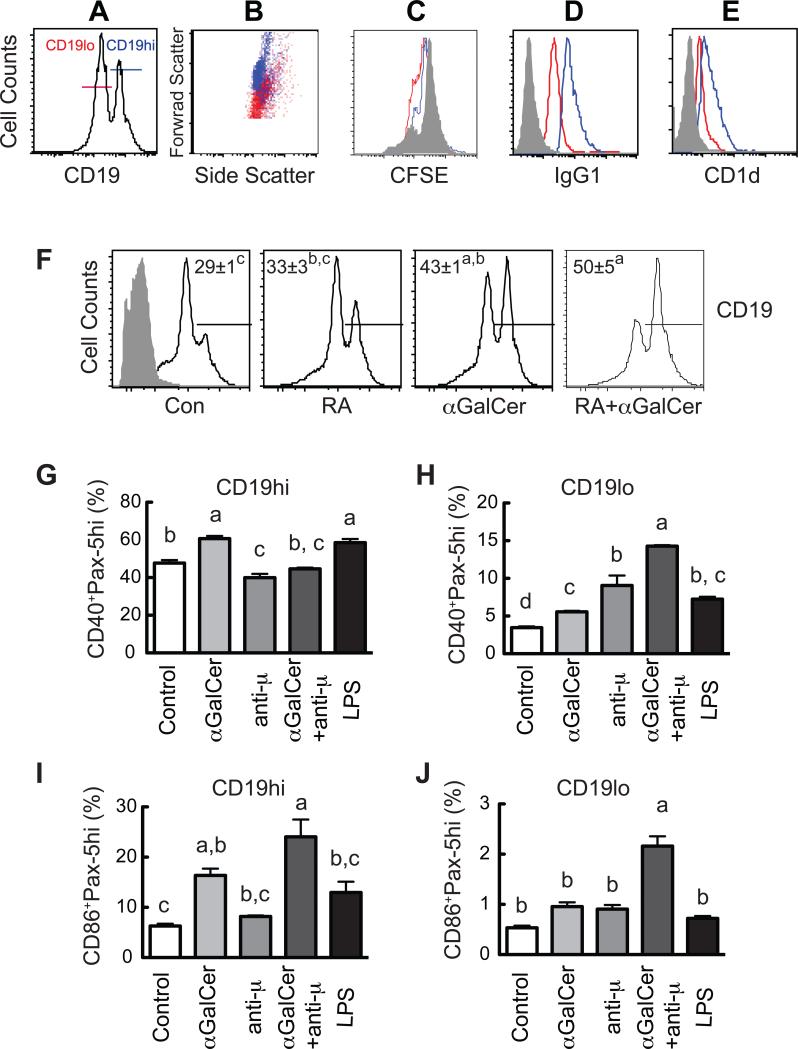
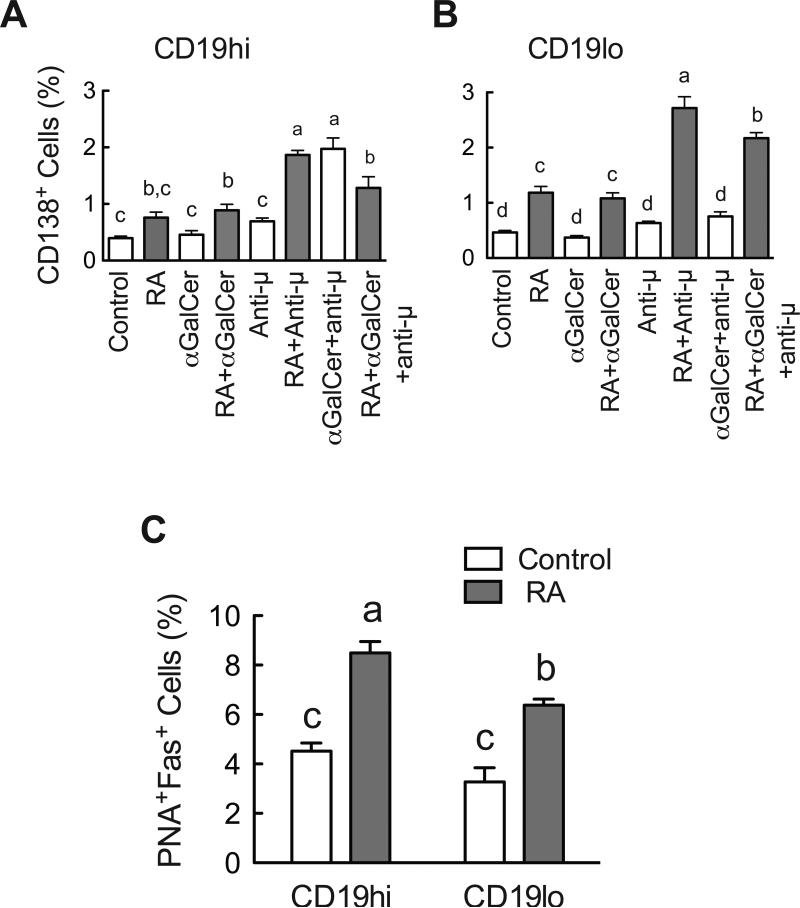
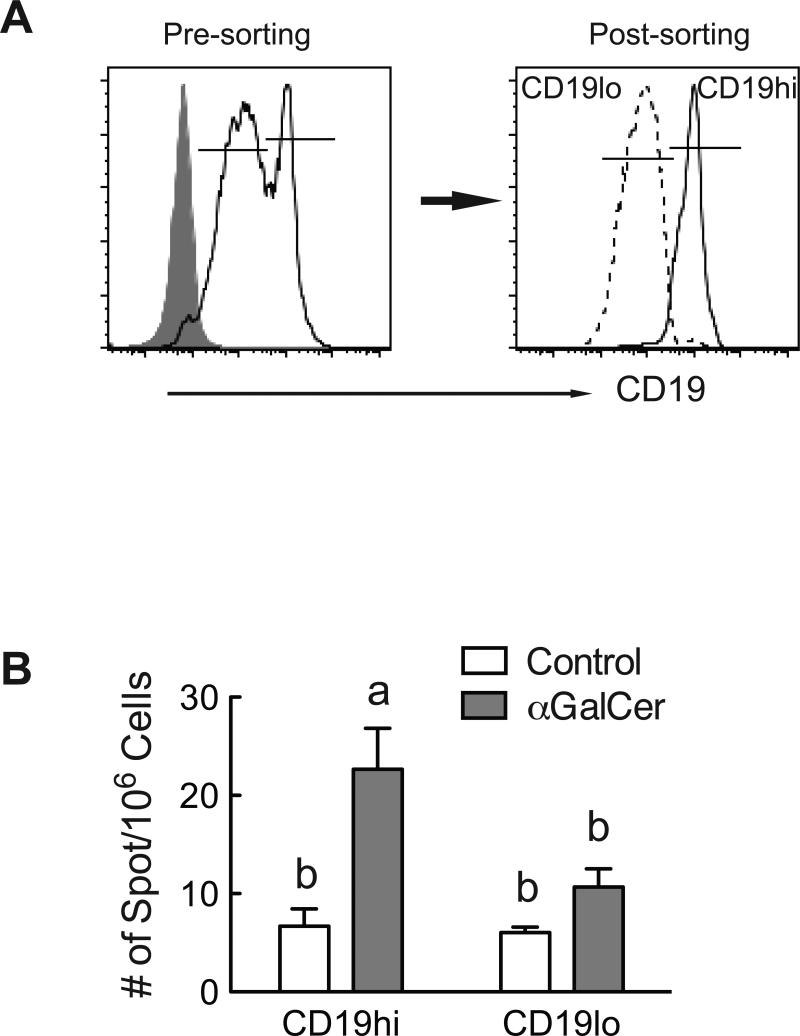
Mature naïve B cells possess a number of BCR coreceptors and other antigen receptors, including the MHC class I-like molecule CD1d, but little is known of the response of B cells to stimulation by the CD1d ligand, α-galactosylceramide (αGalCer). Previously, we showed that all-trans-retinoic acid (RA) increases the expression of CD1d and the magnitude of CD1d-mediated antibody production in vivo. Potential mechanisms could include changes in the expression of costimulatory molecules and transcription factors that regulate plasma cell formation. In the present study, we have used isolated purified B cells and in vivo studies to demonstrate that αGalCer and RA initiate a regulated expression of several genes essential for B cell activation and differentiation, such as Pax-5, Blimp-1, IRF-4 and activation-induced cytidine deaminase (Aid). Moreover, whereas αGalCer mainly increased the expression of Pax-5, CD40 and CD86 that are critical for B cell activation, RA predominantly increased CD138⁺ and Fas⁺-PNA⁺ B cells, which represent more advanced B cell differentiation. It is also noteworthy that αGalCer enriched a CD19hi subset of B cells, which represent B cells with more differentiated phenotype and higher potential for antibody production. In vivo, treatment with αGalCer enriched the CD19hi population, which, after sorting, produced more anti-TT IgG by ELISPOT assay. Together, our data demonstrate that RA and αGalCer can regulate B cell activation and differentiation at multiple levels in a complementary manner, facilitating the progress of B cells towards antibody secreting cells.
Keywords: AID; CD138; CD19; CD40; CD86; GC; IRF; Pax-5; RA; TT; activation induced deaminase; all-trans-retinoic acid; germinal center; interferon regulatory factor; tetanus toxoid; α-galactosylceramide; αGalCer.
Copyright © 2013 Elsevier GmbH. All rights reserved.
Figures
Similar articles
-
Retinoic acid and α-galactosylceramide differentially regulate B cell activation in vitro and augment antibody production in vivo.Clin Vaccine Immunol. 2011 Jun;18(6):1015-20. doi: 10.1128/CVI.00004-11. Epub 2011 Apr 6. Clin Vaccine Immunol. 2011. PMID: 21471300 Free PMC article.
-
All-trans-retinoic acid and CD38 ligation differentially regulate CD1d expression and α-galactosylceramide-induced immune responses.Immunobiology. 2015 Jan;220(1):32-41. doi: 10.1016/j.imbio.2014.09.008. Epub 2014 Sep 16. Immunobiology. 2015. PMID: 25248321 Free PMC article.
-
Vitamin A and immune function: retinoic acid modulates population dynamics in antigen receptor and CD38-stimulated splenic B cells.Proc Natl Acad Sci U S A. 2005 Oct 4;102(40):14142-9. doi: 10.1073/pnas.0505018102. Epub 2005 Aug 10. Proc Natl Acad Sci U S A. 2005. PMID: 16093312 Free PMC article.
-
Augmentation of antibody responses by retinoic acid and costimulatory molecules.Semin Immunol. 2009 Feb;21(1):42-50. doi: 10.1016/j.smim.2008.08.004. Epub 2008 Sep 25. Semin Immunol. 2009. PMID: 18819820 Free PMC article. Review.
-
Affinity of antigen encounter and other early B-cell signals determine B-cell fate.Curr Opin Immunol. 2007 Jun;19(3):275-80. doi: 10.1016/j.coi.2007.04.009. Epub 2007 Apr 12. Curr Opin Immunol. 2007. PMID: 17433651 Free PMC article. Review.
Cited by
-
α-Galactosylceramide stimulates splenic lymphocyte proliferation in vitro and increases antibody production in vivo in late neonatal-age mice.Clin Exp Immunol. 2015 Feb;179(2):188-96. doi: 10.1111/cei.12447. Clin Exp Immunol. 2015. PMID: 25178151 Free PMC article.
-
Latent Tuberculosis Patients Have an Increased Frequency of IFN-γ-Producing CD5+ B Cells, Which Respond Efficiently to Mycobacterial Proteins.Pathogens. 2023 Jun 9;12(6):818. doi: 10.3390/pathogens12060818. Pathogens. 2023. PMID: 37375508 Free PMC article.
-
Host-directed therapy to combat mycobacterial infections.Immunol Rev. 2021 May;301(1):62-83. doi: 10.1111/imr.12951. Epub 2021 Feb 9. Immunol Rev. 2021. PMID: 33565103 Free PMC article. Review.
-
Cellular and molecular functions of hepatic stellate cells in inflammatory responses and liver immunology.Hepatobiliary Surg Nutr. 2014 Dec;3(6):344-63. doi: 10.3978/j.issn.2304-3881.2014.11.03. Hepatobiliary Surg Nutr. 2014. PMID: 25568859 Free PMC article. Review.
-
Potential for use of retinoic acid as an oral vaccine adjuvant.Philos Trans R Soc Lond B Biol Sci. 2015 Jun 19;370(1671):20140145. doi: 10.1098/rstb.2014.0145. Philos Trans R Soc Lond B Biol Sci. 2015. PMID: 25964457 Free PMC article. Review.
References
-
- Aiba Y, Kameyama M, Yamazaki T, Tedder TF, Kurosaki T. Regulation of B-cell development by BCAP and CD19 through their binding to phosphoinositide 3-kinase. Blood. 2008;111:1497–1503. - PubMed
-
- Barral P, Eckl-Dorna J, Harwood NE, De Santo C, Salio M, Illarionov P, Besra GS, Cerundolo V, Batista FD. B cell receptor-mediated uptake of CD1d-restricted antigen augments antibody responses by recruiting invariant NKT cell help in vivo. Proc Natl Acad Sci U S A. 2008;105:8345–8350. - PMC - PubMed
-
- Bouaziz JD, Yanaba K, Tedder TF. Regulatory B cells as inhibitors of immune responses and inflammation. Immunol Rev. 2008;224:201–214. - PubMed
Publication types
MeSH terms
Substances
Grants and funding
LinkOut - more resources
Full Text Sources
Other Literature Sources
Research Materials
Miscellaneous
