. 2013 Jul 8;202(1):129-43.
doi: 10.1083/jcb.201212110. Epub 2013 Jul 1.

Lysosome-mediated processing of chromatin in senescence

Affiliations

Lysosome-mediated processing of chromatin in senescence

Andre Ivanov et al. J Cell Biol. .

Abstract

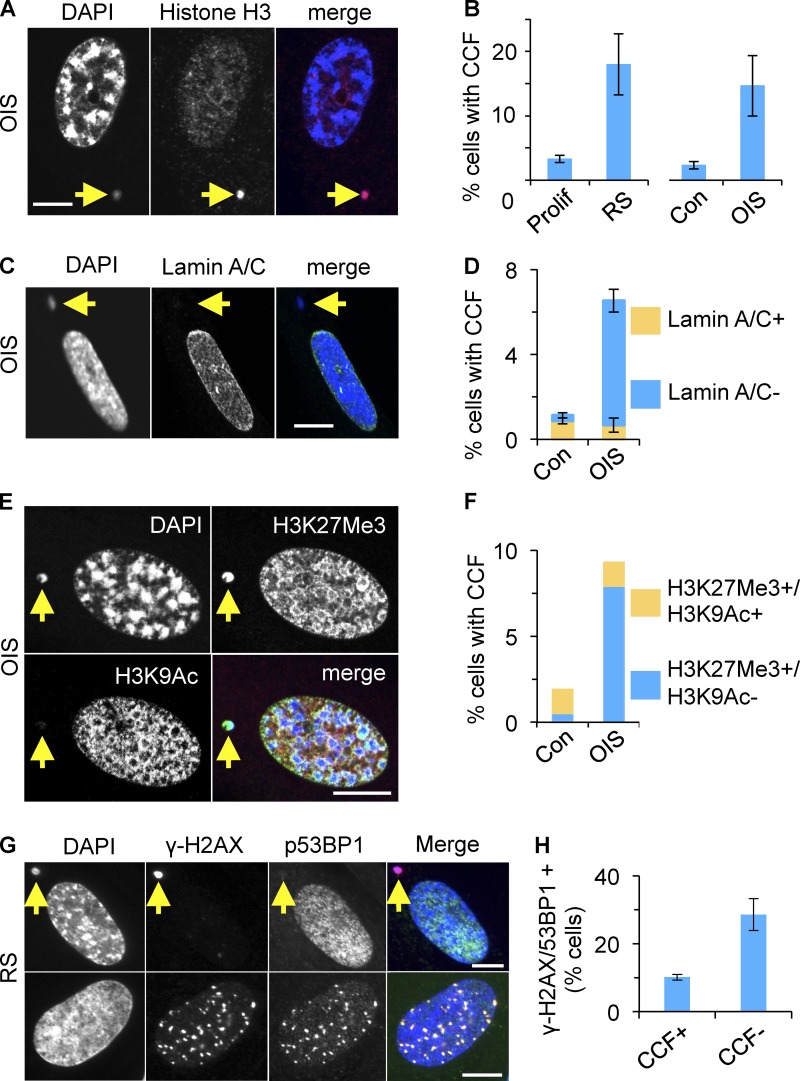
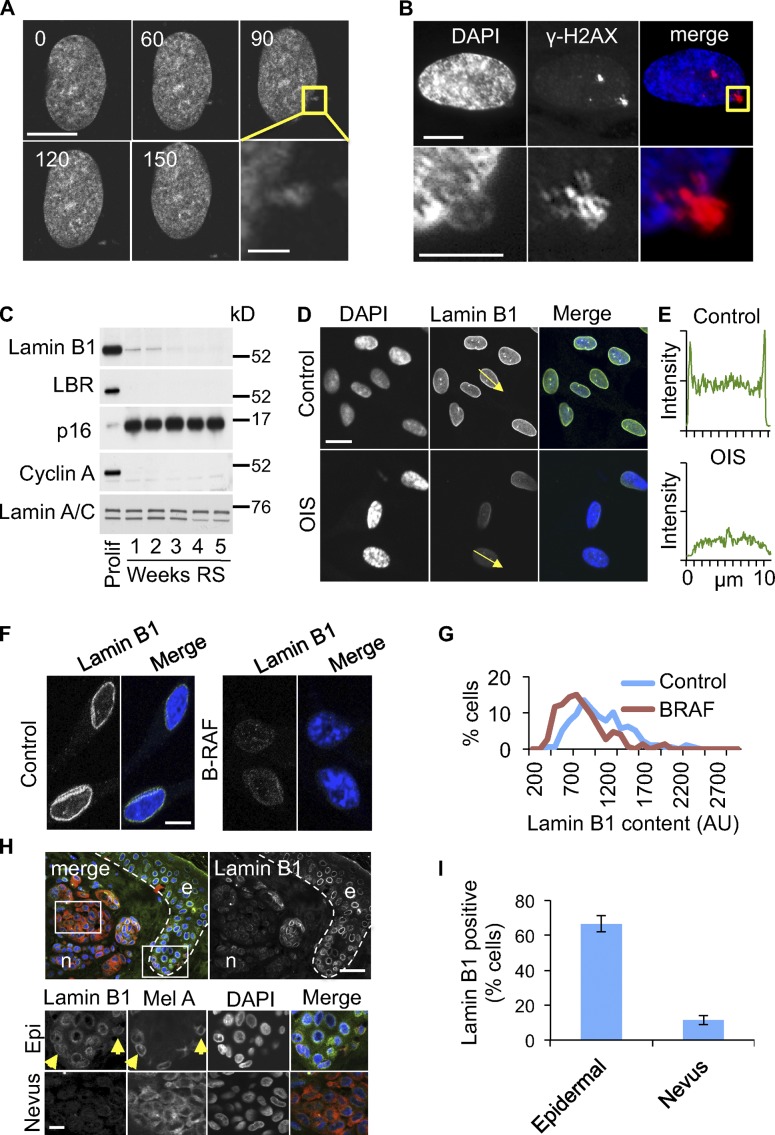
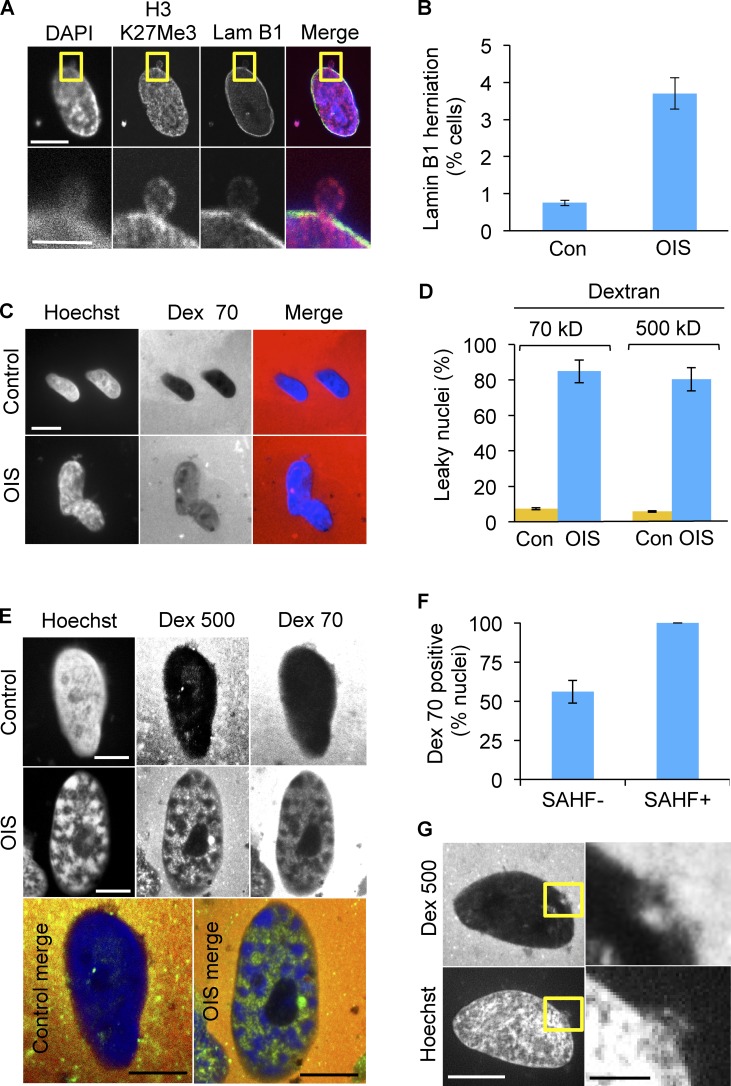
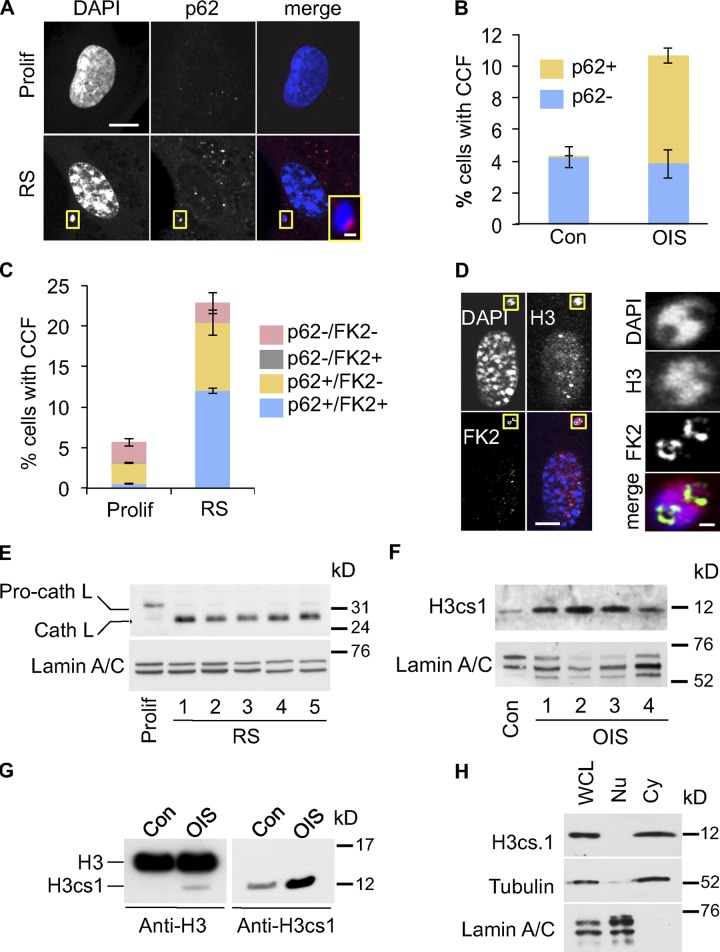
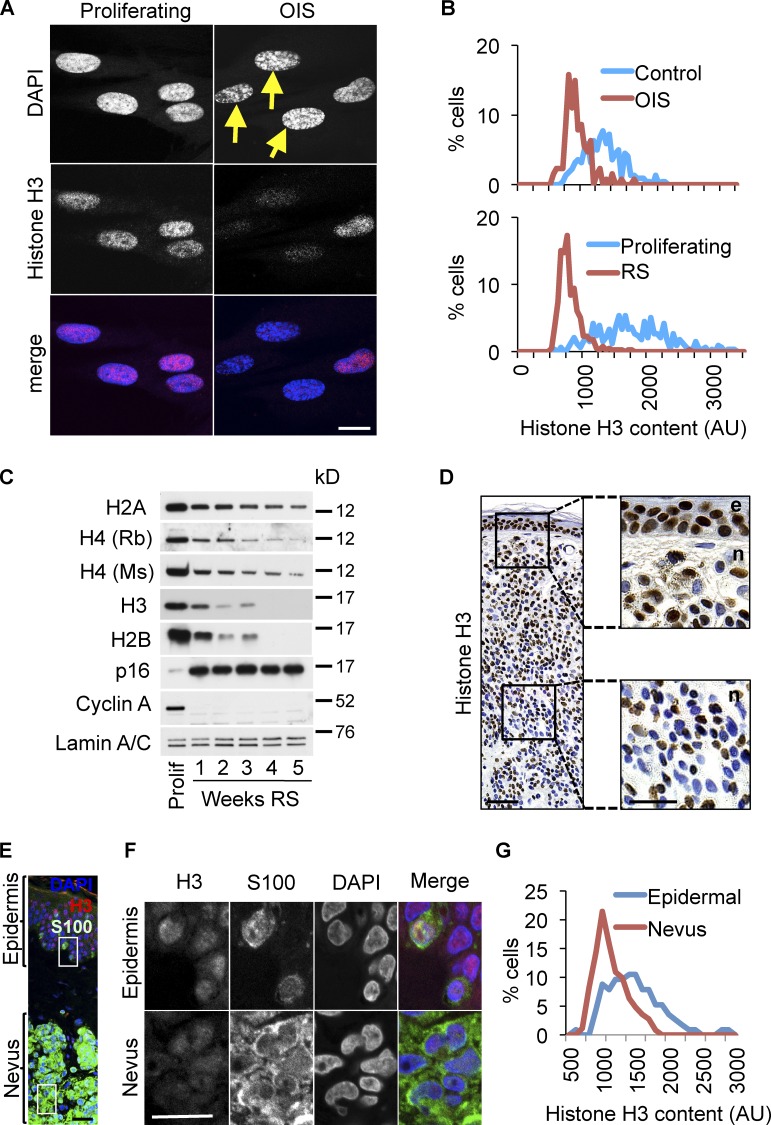
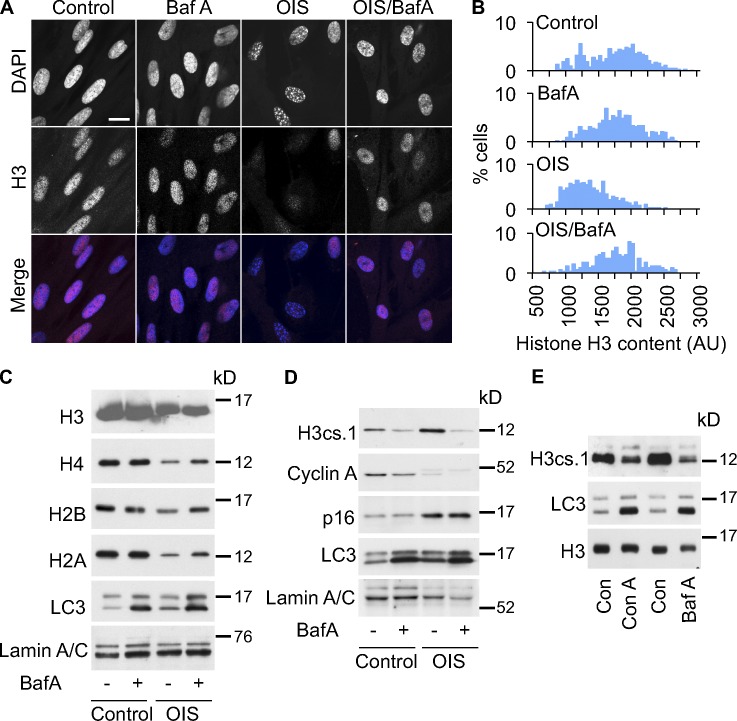
Cellular senescence is a stable proliferation arrest, a potent tumor suppressor mechanism, and a likely contributor to tissue aging. Cellular senescence involves extensive cellular remodeling, including of chromatin structure. Autophagy and lysosomes are important for recycling of cellular constituents and cell remodeling. Here we show that an autophagy/lysosomal pathway processes chromatin in senescent cells. In senescent cells, lamin A/C-negative, but strongly γ-H2AX-positive and H3K27me3-positive, cytoplasmic chromatin fragments (CCFs) budded off nuclei, and this was associated with lamin B1 down-regulation and the loss of nuclear envelope integrity. In the cytoplasm, CCFs were targeted by the autophagy machinery. Senescent cells exhibited markers of lysosomal-mediated proteolytic processing of histones and were progressively depleted of total histone content in a lysosome-dependent manner. In vivo, depletion of histones correlated with nevus maturation, an established histopathologic parameter associated with proliferation arrest and clinical benignancy. We conclude that senescent cells process their chromatin via an autophagy/lysosomal pathway and that this might contribute to stability of senescence and tumor suppression.


Figures

Figure 1.
Figure 1.
Cytoplasmic chromatin fragments in senescent cells. (A) Cytoplasmic chromatin fragments (CCFs) in senescent cells are strongly positive for histone H3. Yellow arrow marks CCF. (B) Increased proportion of cells with CCFs in RS or OIS. Mean ± SEM, n = 3; P < 0.01 (OIS), P < 0.002 (RS). Assays were performed 10 d after induction with tamoxifen (OIS) or 4 wk after the last passage and >90% SA β-gal+ (RS). (C) CCFs in OIS cells are lamin A/C negative. (D) Cells from C were scored for lamin A/C+ and lamin A/C CCFs. Note that the majority of micronuclei in control cells are lamin A/C positive. Mean ± SEM, n = 3; P < 0.0006 for lamin A/C negative CCF con vs. OIS; P < 0.6 for lamin A/C positive CCF con vs. OIS. (E) CCFs in OIS are strongly positive for heterochromatic histone mark H3K27me3 but not for euchromatic mark H3K9ac. (F) Cells from E were scored for indicated histone modifications in CCFs. A single representative experiment is shown and at least 100 cells were scored per slide. Note the majority of micronuclei in control cells are positive for both marks. (G) CCFs in RS contain γ-H2AX but not 53BP1 (top). Intranuclear γ-H2AX foci colocalize with 53BP1 (bottom). (H) CCF+ and CCF cells from G were scored for colocalizing intranuclear γ-H2AX and 53BP1 foci. Mean ± SEM, n = 3; P < 0.019. Bars (in IF panels), 10 µm.
Figure 2.
Figure 2.
Nuclear-to-cytoplasm chromatin blebbing in senescent cells associated with depletion of lamin B1. (A) Extrusion of GFP-H2B–positive chromatin fragment from nonmitotic RS nucleus. Confocal time-lapse microscopy of transiently transfected GFP-H2B–expressing cell, 60× original magnification, 150 nm optical section, time in mins. Bars: 10 µm; (insert) 2 µm. (B) Chromatin fragments blebbing out of nucleus are γ-H2AX positive. Bars: (top) 10 µm; (bottom) 5 µm. (C) Down-regulation of lamin B1 and lamin B receptor (LBR) in RS cells, assayed by Western blot. See Materials and methods for time-course details. (D) Depletion of lamin B1 from OIS cells, assayed by immunofluorescence. (E) A line-scan of lamin B1 fluorescence intensity along the arrows in D. Data shown are from a single representative experiment out of three repeats. (F) Depletion of lamin B1 in BRAFV600E-induced OIS melanocytes in vitro. Bars, 10 µm. (G) Quantitative immunofluorescence of lamin B1 in melanocytes from F. A representative experiment out of two repeats is shown. At least 150 randomly selected cells were assessed. (H) Senescent nevus melanocytes (n) stain less intensely for lamin B1 as compared with nonsenescent melanocytes in epidermis (e). White dotted line shows the basement membrane between the dermis and epidermis. Bottom panels (Epi and Nevus) are expanded from white boxed areas on top. Confocal microscopy for DAPI (blue), MelanA (red), and lamin B1 (green) stained tissue. Bars, 20 µm. (I) Quantitation of results from H for three different nevi. Epifluorescence images of lamin B1– and MelanA-stained nevi were obtained and epidermal or nevus MelanA–positive cells were scored for the presence (positive) of a characteristic lamin B1 “ring.” At least 50 MelanA-expressing epidermal melanocytes and at least 100 nevus melanocytes were scored. Average of three different nevi ± SEM; P < 0.0005.
Figure 3.
Figure 3.
Blebbing of chromatin from nucleus to cytoplasm in senescent cells is associated with loss of nuclear envelope integrity. (A) Herniation of H3K27me3-positive chromatin into the cytoplasm of OIS cells. Yellow boxed area is magnified in bottom panels. Bars: (top panels) 10 µm; (bottom panels) 5 µm. (B) Quantitation of lamin B1 gaps or herniations in OIS. Mean ± SEM, n = 2; P < 0.01. (C) Isolated nuclei of senescent cells are permeable to both 70- and 500-kD dextrans, indicating impairment of the barrier function of nuclear envelope. Dark nuclei exclude fluorescent dextran. Bars, 10 µm. (D) Quantitation of results from C. Mean ± SD, n = 4; P < 0.000001 for both 70- and 500-kD dextrans. (E) Representative OIS SAHF+ nucleus showing dextran permeability. Bars, 10 µm. (F) Quantitation of dextran 70 uptake in SAHF+ and SAHF OIS cells. P < 1.9 × 10⁻⁵. (G) In individual nuclei, chromatin extrusion and dextran intrusion occurred in close physical proximity. Right-hand panels are expanded from yellow boxed areas on the left. Bars: (left) 10 µm; (right) 2 µm.
Figure 4.
Figure 4.
Cytoplasmic histone is processed by a lysosomal/autophagy pathway. (A) Close juxtaposition of senescence-associated CCF (RS) with p62 nuclear bodies. Bars: 10 µm; (inset) 1 µm. (B) Quantitation of control and OIS cells with CCF overlapping p62 (p62+) or not (p62). Mean ± SEM, n = 3. (C) Quantitation of proliferating and RS cells with CCF overlapping p62 (p62+) or not (p62) and protein ubiquitination (FK2+) or not (FK2). Mean ± SEM, n = 3; P < 0.0008 for FK2+/p62+ CCF, comparing proliferating and RS cells. (D) Ubiquitinated proteins appear to line chromatin surface in CCF. Yellow boxed areas are magnified in right-hand panels. Bars: (left panels) 10 µm; (right panels) 1 µm. (E) Apparent activation of cathepsin L in RS IMR90 cells. In contrast to RS cells, the majority of cathepsin L in proliferating control cells exists in its inactive pro-cathepsin L form. Loading was normalized by cell number and lamin A/C was used as a loading control. See Materials and methods for details of time course. (F) Accumulation of H3cs.1, a specific N-terminal cleavage product of H3, in OIS cells. See Materials and methods for details of time course. Western blotting was performed using the same cellular lysates as in Fig. S4 B, and the same lamin A/C panel is shown in both figures. (G) Accumulation of H3cs.1 and corresponding high mobility H3 in OIS. (H) Predominant cytoplasmic localization of H3cs.1 in senescent cells. α-Tubulin and lamin A/C were used as fractionation controls for cytoplasmic and nuclear fractions, respectively.
Figure 5.
Figure 5.
Senescent cells in vitro and in vivo contain reduced histone content. (A) Immunofluorescent confocal images of histone H3 in control or OIS cells (11 d after activation of ER-RASG12V). Yellow arrows indicate cells with most pronounced SAHF. (B) Quantitative immunofluorescence analysis of histone H3 in RS and OIS cells. Representative of two independent experiments. (C) Progressive loss of core histones in senescent IMR90 cells in replicative senescence (RS). Lysates were normalized by cell number and an equal number of cells was loaded per each lane. Lamin A/C was used as a confirmatory loading control. See Materials and methods for details of time course. (D) Immunohistochemistry for histone H3 in human dermal nevus (n) and adjacent epidermis (e). Right-hand panels are expanded from boxed areas on the left. Note decreased nevus staining for H3 (right bottom) as compared with epidermis (right top). Bars: (left) 100 µm; (right) 50 µm. (E) Immunofluorescence of histone H3 (red) and S100 (melanocytes [green]) in human benign nevus and adjacent epidermis. Bars, 20 µm. (F) Higher magnification of boxed regions in E shows reduced staining for H3 in nevus (bottom panels), compared with epidermal melanocytes (top panels). Bars, 20 µm. (G) Quantitative immunofluorescence of H3 in epidermal and nevus melanocytes. Images were obtained in blue (DAPI), green (S100), and red (H3) channels and then H3 intensity was measured in either S100+ epidermal cells, strictly adjacent to the basal membrane, or in S100+ nevus melanocytes. H3 intensity histograms represent fluorescence intensity distribution, combined from three individual nevi. At least 150 epidermal (50 per nevus) and 300 nevus (100 per nevus) melanocytes were assessed.
Figure 6.
Figure 6.
Senescence-associated loss of histones is V-ATPase dependent. (A) Bafilomycin A1 (BafA1) blocks the loss of nuclear histone H3 content in cells undergoing OIS. BafA1 was added to cells at 50 nM on day 5 after RASG12V induction. Cells were harvested 24 h later, and stained for histone H3. Bars, 10 µm. (B) Quantitative histone H3 immunofluorescence in cells from A. Single representative experiment out of three repeats. (C) RASG12V-induced OIS cells were treated with BafA1 as described in A and then assessed for histones by Western blot. LC3 I/II has been used as a control for BafA1 activity. Lysates from 10,000 cells were loaded per well. (D) BafA1 blocks the accumulation of H3cs.1 in cells undergoing OIS. (E) BafA1 and concanamycin A (Con A) block the accumulation of H3cs.1 in RS cells.

Comment in

Similar articles

Cited by

References

    1. Adams P.D. 2009. Healing and hurting: molecular mechanisms, functions, and pathologies of cellular senescence. Mol. Cell. 36:2–14 10.1016/j.molcel.2009.09.021 - DOI - PubMed
    1. Adams-Cioaba M.A., Krupa J.C., Xu C., Mort J.S., Min J. 2011. Structural basis for the recognition and cleavage of histone H3 by cathepsin L. Nat Commun. 2:197 10.1038/ncomms1204 - DOI - PMC - PubMed
    1. Barnhill R., Piepkorn M., Busam K., 2004. Pathology of Melanocytic Nevi and Malignant Melanoma. Springer; 2nd ed, XIV, 406 pp
    1. Barradas M., Anderton E., Acosta J.C., Li S., Banito A., Rodriguez-Niedenführ M., Maertens G., Banck M., Zhou M.M., Walsh M.J., et al. 2009. Histone demethylase JMJD3 contributes to epigenetic control of INK4a/ARF by oncogenic RAS. Genes Dev. 23:1177–1182 10.1101/gad.511109 - DOI - PMC - PubMed
    1. Bodnar A.G., Ouellette M., Frolkis M., Holt S.E., Chiu C.P., Morin G.B., Harley C.B., Shay J.W., Lichtsteiner S., Wright W.E. 1998. Extension of life-span by introduction of telomerase into normal human cells. Science. 279:349–352 10.1126/science.279.5349.349 - DOI - PubMed

Publication types