. 2013 Aug;19(8):1023-9.
doi: 10.1038/nm.3216. Epub 2013 Jun 30.

ETS factors reprogram the androgen receptor cistrome and prime prostate tumorigenesis in response to PTEN loss

Affiliations

ETS factors reprogram the androgen receptor cistrome and prime prostate tumorigenesis in response to PTEN loss

Yu Chen et al. Nat Med. 2013 Aug.

Abstract

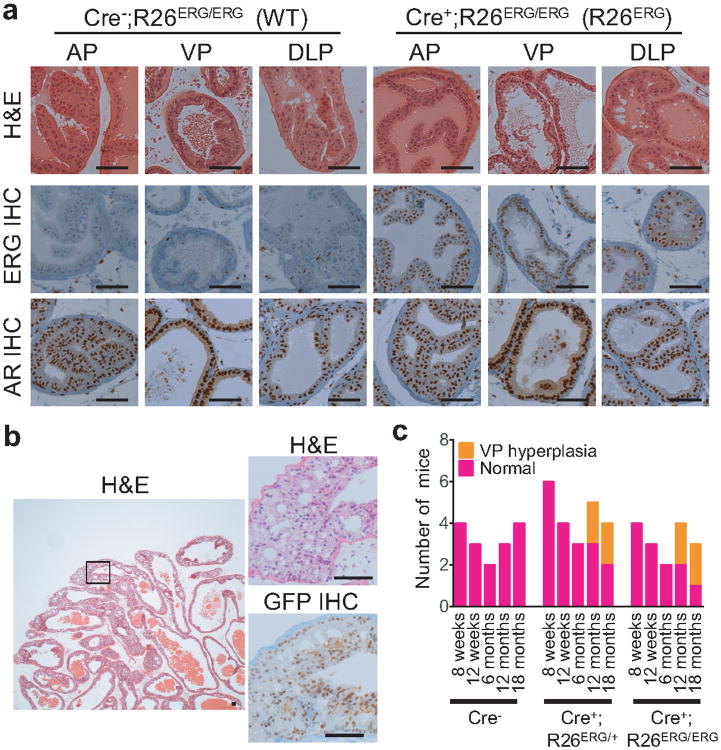
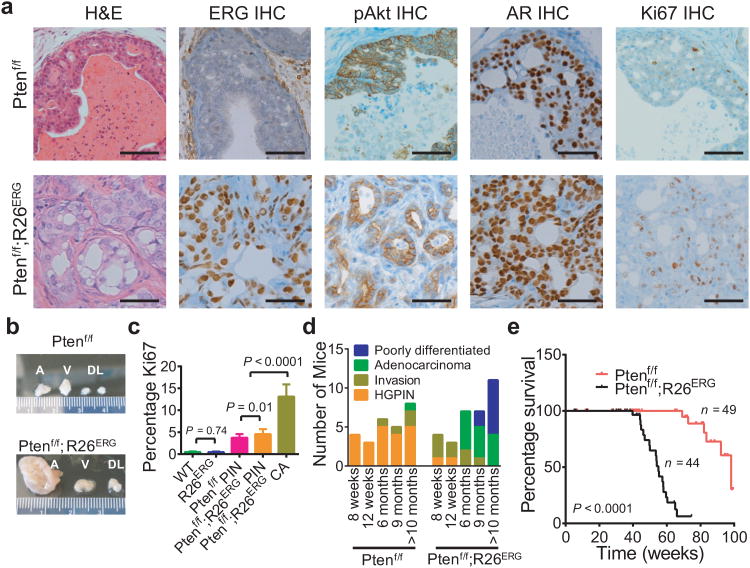
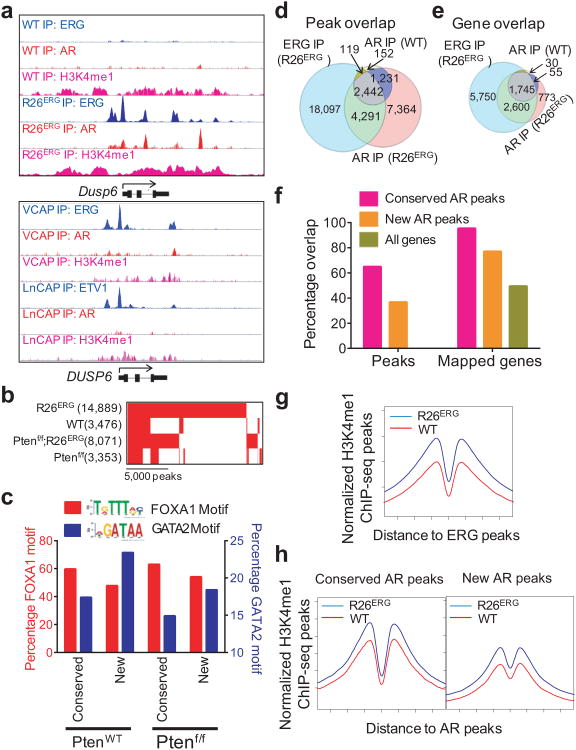
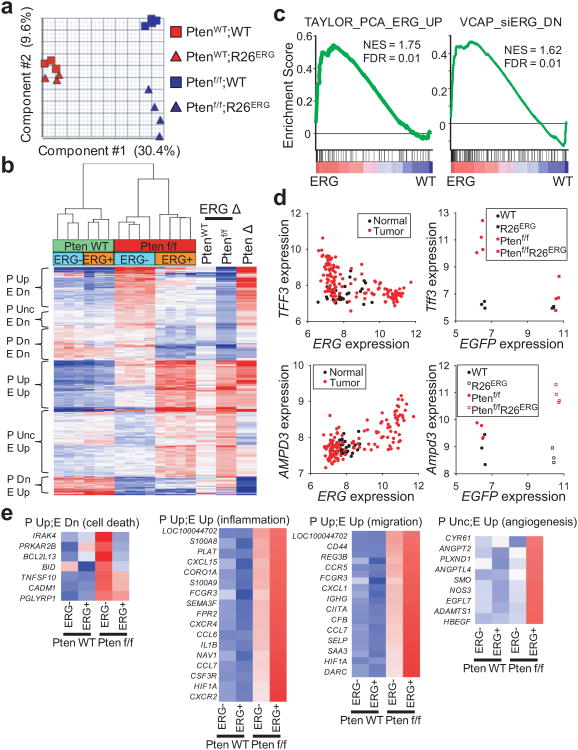
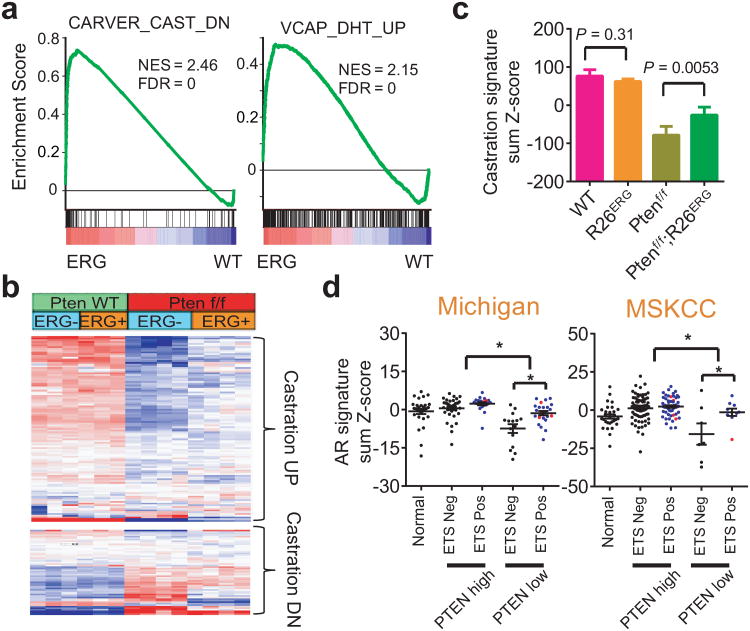
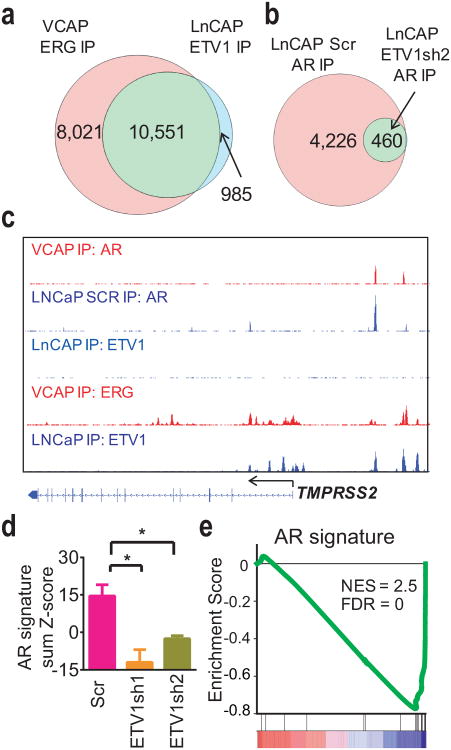
Studies of ETS-mediated prostate oncogenesis have been hampered by a lack of suitable experimental systems. Here we describe a new conditional mouse model that shows robust, homogenous ERG expression throughout the prostate. When combined with homozygous Pten loss, the mice developed accelerated, highly penetrant invasive prostate cancer. In mouse prostate tissue, ERG markedly increased androgen receptor (AR) binding. Robust ERG-mediated transcriptional changes, observed only in the setting of Pten loss, included the restoration of AR transcriptional output and upregulation of genes involved in cell death, migration, inflammation and angiogenesis. Similarly, ETS variant 1 (ETV1) positively regulated the AR cistrome and transcriptional output in ETV1-translocated, PTEN-deficient human prostate cancer cells. In two large clinical cohorts, expression of ERG and ETV1 correlated with higher AR transcriptional output in PTEN-deficient prostate cancer specimens. We propose that ETS factors cause prostate-specific transformation by altering the AR cistrome, priming the prostate epithelium to respond to aberrant upstream signals such as PTEN loss.


Figures

Figure 1
Figure 1. ERG expression induces minimal histological phenotype in mouse prostates
(a) Representative H&E histology, ERG IHC, and AR IHC of the anterior, ventral and dorsolateral (AP, VP and DLP) lobes in a 3-month old Pb-Cre4;R26ERG/ERG(R26ERG) and a littermate control Cre-negative (WT) mouse prostates. Scale bars: 50 μm. (b) A representative low-power H&E histology image of VP hyperplasia in the prostate of a 13-month old R26ERG mouse is shown on the left. High power magnification of boxed region, including H&E and EGFP IHC, is shown on the right is shown on right. Scale bars: 50 μm. (c) Summary of histological findings of WT (Cre+), ERG heterozygous (Cre+;R26ERG/+) and ERG homozygous (Cre+; R26ERG/ERG) mouse prostates examined at 8 and 12 weeks, 6, 12 and 18 months respectively.
Figure 2
Figure 2. ERG robustly cooperates with Pten loss in prostate tumorigenesis
(a) Comparison of H&E prostate histology, ERG IHC, phosphorylated AKT (pAKT) IHC, AR IHC and Ki67 IHC of representative 6-month old Cre+;Ptenf/f (Ptenf/f) and Cre+;Ptenf/f;R26ERG/ERG (Ptenf/f;R26ERG) prostate. Scale bars: 50 μm. (b) A Representative example of gross appearance of anterior (A), ventral (V), dorsolateral (DL) lobes of Ptenf/f and Ptenf/f;R26ERG mice euthanized at 6 months. (c) Quantification of Ki67 (3 mice, 3 20× fields per mouse, mean ± SD) of 6-month old WT, R26ERG, Ptenf/f and Ptenf/f;R26ERG mouse prostates. For Ptenf/f;R26ERG mice, we separately quantified the PIN which is histologically similar to that of Ptenf/f mice, and adenocarcinoma. (d) Summary of histological findings of Ptenf/f and Ptenf/f;R26ERG mouse prostates examined at 8 and 12 weeks, 6, 9 and >10 months respectively. Mice were characterized by the most advanced finding found on histology. (e) Kaplan-Meier survival analysis of Ptenf/f and Ptenf/f;R26ERG mice.
Figure 3
Figure 3. ERG localizes to pre-defined H3K4me1 marked regions and reprograms genome-wide localization of AR
(a) Representative ChIP-seq profiles of ERG, AR, and H3K4me1 at the Dusp6 gene locus in WT and R26ERG mouse prostates and at the human DUSP6 gene locus in the ERG-positive VCAP and the ETV1-positive LNCaP human prostate cancer cell lines. (b) Overlap of AR peaks in WT, R26ERG, Ptenf/f and Ptenf/f;R26ERG mouse prostates. Number of peaks is in parenthesis. (c) Bar graph of percentage of conserved AR peaks in ERG-negative mice and new AR peaks only in ERG-positive mice that have nearby FOXA1 (red, left y-axis) and GATA2 (blue, right y-axis) motifs in PtenWT and Ptenf/f prostates. (d) Venn diagram of ERG ChIP-seq peaks in R26ERG mice, AR-ChIP-seq peaks in WT mice, and AR-ChIP-seq peaks in R26ERG mice. Overlap of ERG and AR peaks in both WT and R26ERG mice are significant (P < 2.2×10⁻¹⁶). (e) Overlap of mapped genes of ERG and AR peaks in WT and R26ERG mouse prostates. (f) LEFT: Graph of the percent of conserved AR peaks in WT mice and new AR peaks in R26ERG mice that overlap with ERG peaks in R26ERG mice. RIGHT: Graph of percent of mapped genes of conserved AR peaks, of new AR peaks, and of all Refseq genes that overlap with mapped genes of ERG peaks. (g) Profiles of H3K4me1 ChIP-seq in WT and R26ERG mouse around ERG binding sites of R26ERG mice. (h) Profiles of H3K4me1 ChIP-seq associated with the conserved AR binding sites (left panel) and new AR binding sites (right panel) induced by ERG expression in R26ERG compared to WT mouse prostates.
Figure 4
Figure 4. ERG expression primes prostate to respond to Pten loss
(a) Principle component analysis of expression profile of 4-month old WT, R26ERG, Ptenf/f, and Ptenf/f;R26ERG mouse prostates. Component 1 is determined by Pten status and component 2 by ERG status. (b) Hierarchical clustering of genes significantly changed either between WT and R26ERG or between Ptenf/f and Ptenf/f;R26ERG mouse prostates (FDR<0.3, fold-change > 1.5). Clustering groups the genes by effect of Pten loss [Pten loss up (P Up), Pten loss unchanged (P Unc), Pten loss down (P Dn)] and ERG expression [ERG up (E Up), ERG down (E Dn)]. The three vertical heatmaps on the right show the fold-change of ERG expression in WT mice (between WT and R26ERG) and in Ptenf/f mice (between Ptenf/f and Ptenf/f;R26ERG) and effect of Pten loss in ERG-negative mice. (c) GSEA of the ERG expression profile in Pten loss mouse prostates (Ptenf/f;R26ERG vs. Ptenf/f) showing that a gene set defined by ERG-positive vs. ERG-negative human prostate cancers (Taylor_PCA_ERG_UP) and a gene set defined by genes down-regulated after ERG knockdown in VCAP cells1616 (VCAP_siERG_DN) are positively enriched. (d) Scatter plot of ERG vs. TFF3 and ERG vs AMPD3 expression in human prostate cancer and normal prostate tissue (left) and scatter plot of EGFP (linked to ERG via IRES) vs Tff3 and EGFP vs Ampd3 expression in mouse prostate (right). (e) Normalized expression of genes that belong to cell death, inflammation, migration, and angiogenesis functional groups that are regulated by ERG and Pten loss.
Figure 5
Figure 5. ERG increases androgen receptor signaling in Pten loss prostate cancer
(a) GSEA of the ERG expression profile in Pten loss mouse prostates (Ptenf/f;R26ERG vs. Ptenf/f) showing that the mouse prostate specific AR-dependent gene set (defined by changes from mouse castration) and human AR-dependent gene set (defined by genes upregulated by DHT in ERG-positive VCAP cells) are both significantly and positively enriched. (b) Hierarchical clustering of mouse androgen upregulated genes (Castration DN) and androgen downregulated genes (Castration UP) in mouse prostates. The data shows that many androgen upregulated genes are downregulated by Pten loss and restored by ERG expression and many androgen downregulated genes are upregulated by Pten loss and decreased by ERG expression. (c) The sum of the normalized expression of mouse androgen-regulated genes, defined as genes downregulated by castration, by genotype (mean ± SD). (d) Sum of normalized expression of human androgen-regulated genes from University of Michigan (UM) rapid autopsy series and MSKCC prostatectomy series. Black dots, blue dots, and red dots represent ETS-negative, ERG-positive, and ETV1-positive samples respectively (mean ± SEM). For UM series, significant comparisons are: PTEN high vs. PTEN low (P < 0.0001) and PTEN low;ETS neg vs PTEN low;ETS pos (P = 0.001). For MSKCC series, significant comparisons are: PTEN high vs. PTEN low (P < 0.0001) and PTEN low;ETS neg vs PTEN low;ETS pos (P = 0.043).
Figure 6
Figure 6. ETV1 alters the AR cistrome and the AR-dependent transcriptome LNCaP cells
(a) Overlap of ETV1 ChIP-seq peaks in LNCaP cells with published ERG ChIP-seq peaks in VCAP cells. (b) Overlap of AR ChIP-seq peaks in LNCaP cells 72-hours after infection with scrambled shRNA and ETV1sh2 shRNA. (c) Representative ChIP-seq profile at the TMPRSS2 locus showing ERG and AR profiles in VCAP cells and ETV1 baseline profile in LNCaP cells and AR profiles LNCaP cells infected with scrambled and ETV1sh2 shRNA. (d) The sum of normalized expression of genes in an AR signature from expression profiling in LNCaP cells 72-hours after infection with scrambled and two ETV1 shRNAs (n = 3, mean ± SD). Significant comparisons are Scr vs ETV1sh1 (P = 0.0026) and Scr vs ETV1sh2 (P = 0.0033). (e) GSEA profile showing that the AR signature gene set is highly enriched among genes downregulated by ETV1 knockdown.

Comment in

References

    1. Tomlins SA, et al. Recurrent fusion of TMPRSS2 and ETS transcription factor genes in prostate cancer. Science. 2005;310:644–648. - PubMed
    1. Tomlins SA, et al. TMPRSS2:ETV4 gene fusions define a third molecular subtype of prostate cancer. Cancer Res. 2006;66:3396–3400. - PubMed
    1. Helgeson BE, et al. Characterization of TMPRSS2:ETV5 and SLC45A3:ETV5 gene fusions in prostate cancer. Cancer Res. 2008;68:73–80. - PubMed
    1. Paulo P, et al. FLI1 is a novel ETS transcription factor involved in gene fusions in prostate cancer. Genes Chromosomes Cancer. 2012;51:240–249. - PubMed
    1. Mosquera JM, et al. Characterization of TMPRSS2-ERG fusion high-grade prostatic intraepithelial neoplasia and potential clinical implications. Clin Cancer Res. 2008;14:3380–3385. - PMC - PubMed

Publication types

MeSH terms

Associated data