. 2013 Aug;19(8):1047-53.
doi: 10.1038/nm.3218. Epub 2013 Jun 30.

Origin and function of myofibroblasts in kidney fibrosis

Affiliations

Origin and function of myofibroblasts in kidney fibrosis

Valerie S LeBleu et al. Nat Med. 2013 Aug.

Abstract

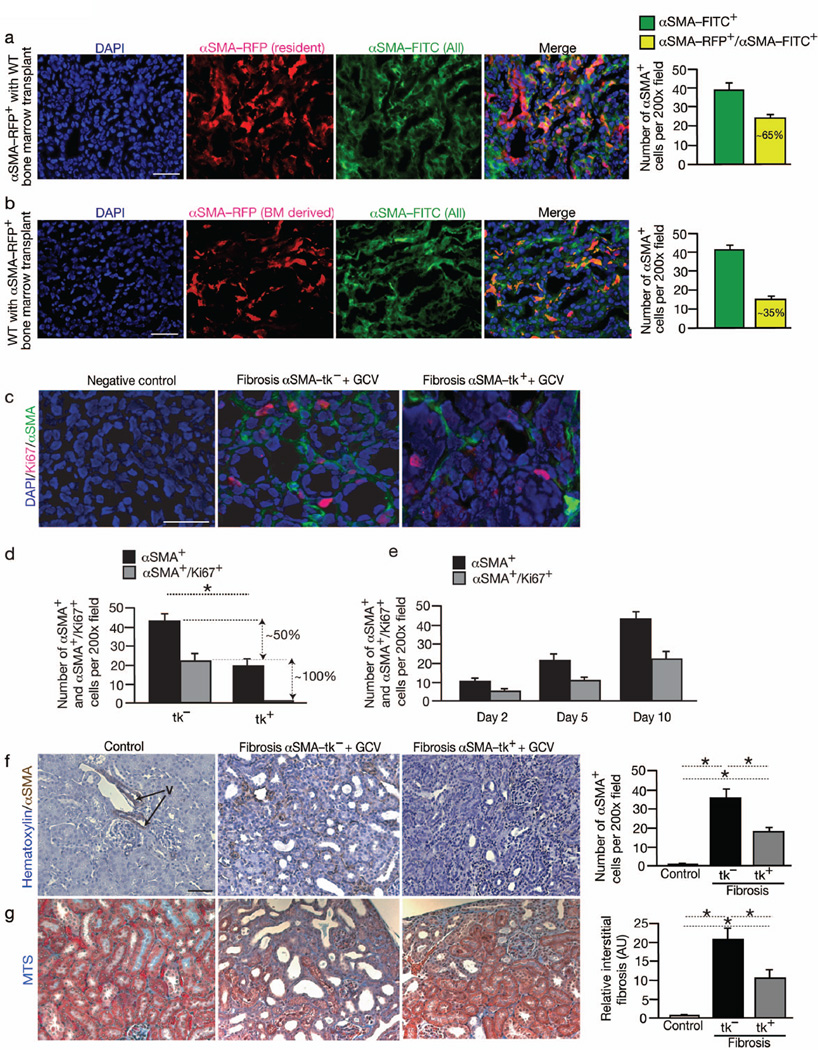
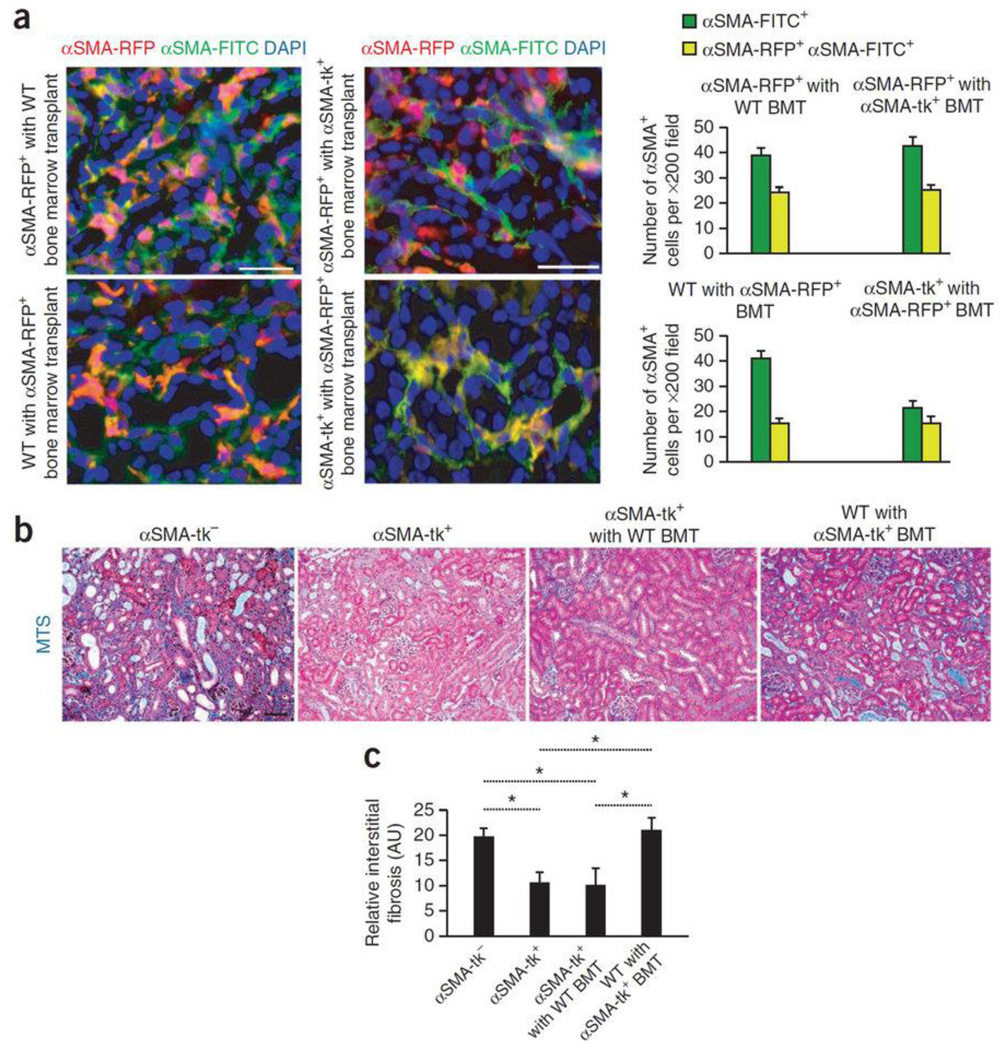
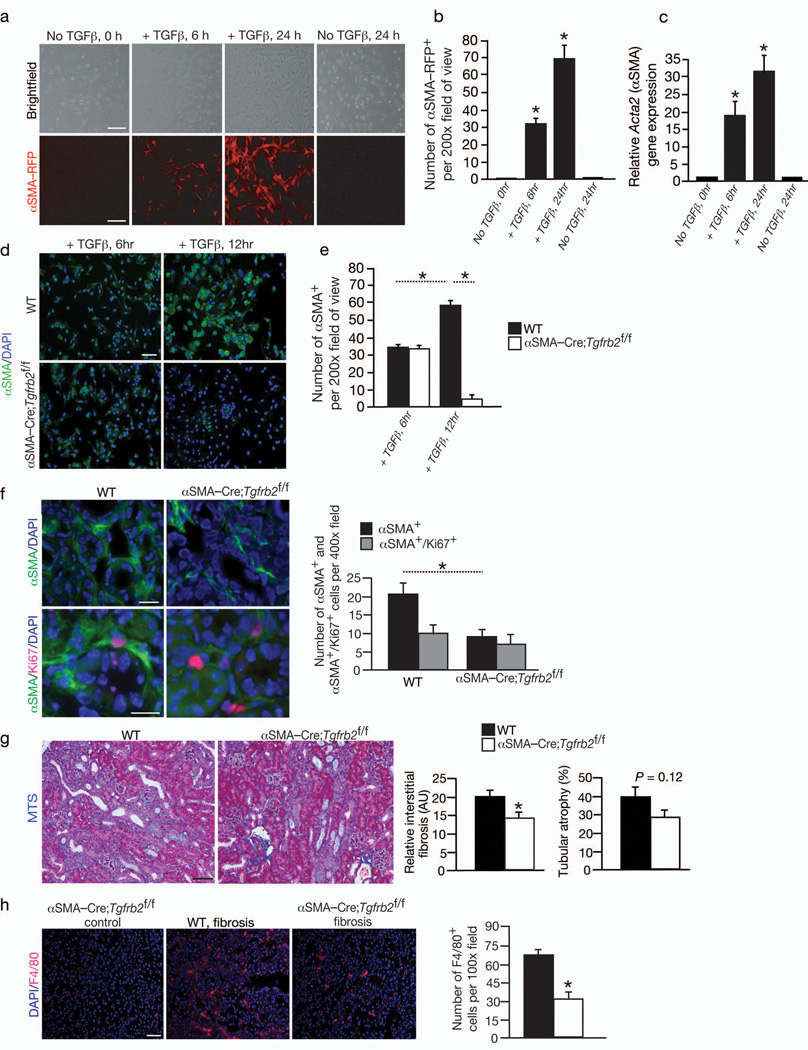
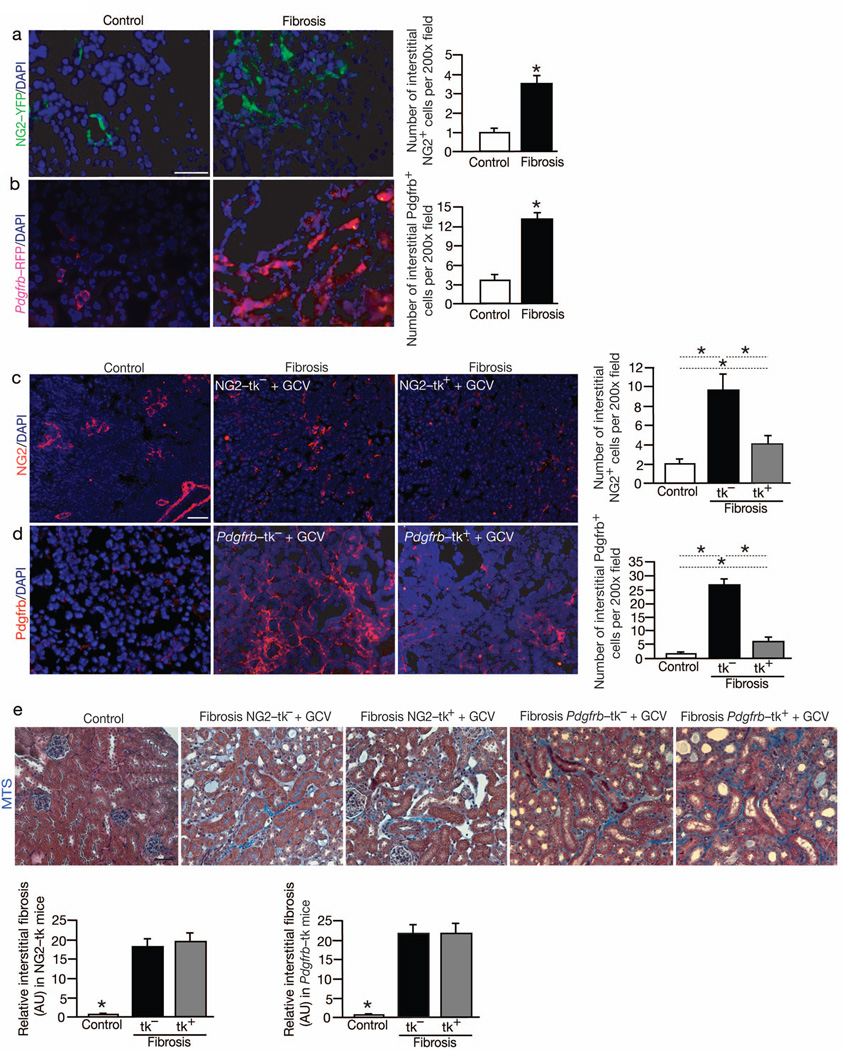
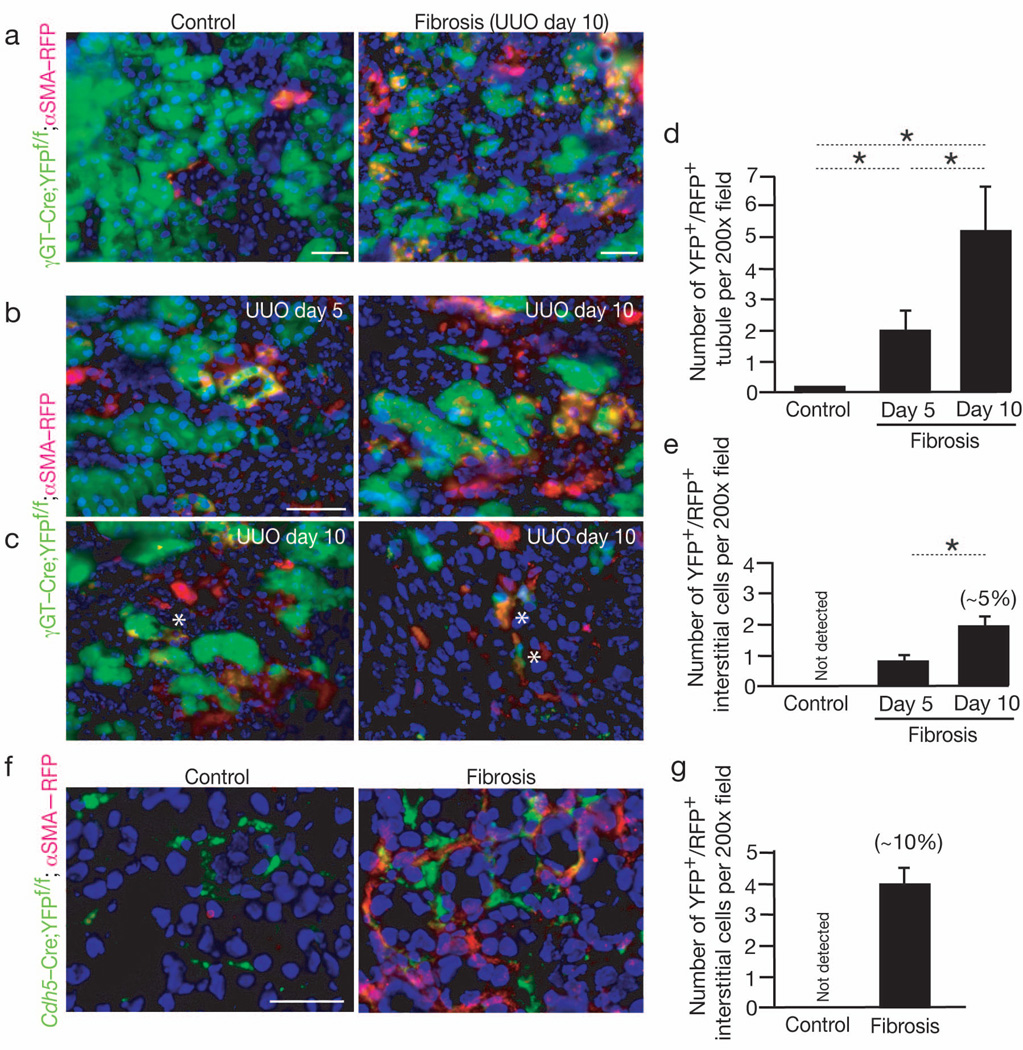
Myofibroblasts are associated with organ fibrosis, but their precise origin and functional role remain unknown. We used multiple genetically engineered mice to track, fate map and ablate cells to determine the source and function of myofibroblasts in kidney fibrosis. Through this comprehensive analysis, we identified that the total pool of myofibroblasts is split, with 50% arising from local resident fibroblasts through proliferation. The nonproliferating myofibroblasts derive through differentiation from bone marrow (35%), the endothelial-to-mesenchymal transition program (10%) and the epithelial-to-mesenchymal transition program (5%). Specific deletion of Tgfbr2 in α-smooth muscle actin (αSMA)(+) cells revealed the importance of this pathway in the recruitment of myofibroblasts through differentiation. Using genetic mouse models and a fate-mapping strategy, we determined that vascular pericytes probably do not contribute to the emergence of myofibroblasts or fibrosis. Our data suggest that targeting diverse pathways is required to substantially inhibit the composite accumulation of myofibroblasts in kidney fibrosis.


Conflict of interest statement

Conflict of Interest: None

Figures

Fig. 1
Fig. 1. αSMA+ myofibroblasts derive from resident tissue cells and bone marrow and functionally contribute to renal fibrosis
(a) Immunolabeling for total αSMA+ population (αSMA-FITC+ or green) of fibrotic kidney of αSMA-RFP mice transplanted with bone marrow from wild type (WT) donor (n = 5). Graph depicts the number of all αSMA+ cells (αSMA-FITC+ or green) and αSMA+ cells from recipient (resident) (αSMA-FITC+/αSMA-RFP+). Relative percentage is listed. (b) Immunolabeling for total αSMA+ population (αSMA-FITC+ or green) of fibrotic kidney of WT mice transplanted with bone marrow from αSMA-RFP donor (n = 5). Graph depicts the number of all αSMA+ cells (αSMA-FITC+ or green) and αSMA+ cells from bone marrow (αSMAFITC+/ αSMA-RFP+). Relative percentage is listed. (c) Immunolabeling for αSMA and Ki67 in fibrotic kidney of αSMA-tk– control mice (n = 5) and αSMA-tk+ mice (n = 5) treated with GCV at day 10 post UUO and (d) quantitation of αSMA+/Ki67+ myofibroblasts. Negative control: secondary antibody only. (e) Quantitation of αSMA+/Ki67+ myofibroblasts in fibrotic kidney 2 days (n = 5) and 5 days (n = 5) post UUO. (f) Immunohistochemistry labeling and quantitative analyses for αSMA in healthy contralateral (Control, n = 5) and fibrotic kidneys from litter mate wild type (αSMA-tk) (n = 5) and αSMA-tk+ mice (n = 5) treated with ganciclovir (GCV). Arrows point to vessel: ‘V’. (g) Representative Masson Trichrome staining (MTS) and morphometric analysis for relative interstitial fibrosis of indicated experimental groups (Control: healthy contralateral, tk: αSMA-tk, and tk+ αSMA-tk+; all treated with GCV). AU: Arbitrary Units. DAPI(blue): nuclei. Scale bar: 50 µm. Data is presented as mean ± s.e.m. t-test, *P < 0.05.
Fig. 2
Fig. 2. Bone marrow derived myofibroblasts contribute to fibrosis and emerge independently from proliferation
(a) Immunolabeling for all αSMA+ cells (αSMA-FITC+) of fibrotic kidney of indicated experimental groups. Graph depicts the number of all αSMA+ cells (αSMA-FITC+) and αSMA-RFP+/αSMA-FITC+ cells from either bone marrow or resident, depending on host/donor transplantation group (in each group n = 5). Left panels are insets from Fig. 1a–b. (b) Representative Masson Trichrome staining (MTS) of littermate wild type (WT) control (αSMA-tk, n = 5), αSMA-tk+ (n = 5), αSMA-tk+ with WT bone marrow transplant (BMT) (n = 5), and WT with αSMA-tk+ BMT fibrotic kidneys treated with GCV (n = 5). (c) Morphometric analysis for relative interstitial fibrosis in indicated experimental groups. AU: Arbitrary Units. DAPI (blue): nuclei. Scale bar: 50 µm. Data is presented as mean ± s.e.m. t-test, *P < 0.05.
Fig. 3
Fig. 3. Bone marrow derived cells differentiate into αSMA+ myofibroblasts in fibrosis via Tgfbr2 signaling pathway
(a). Brightfield and RFP imaging of MSCs from αSMA-RFP mice (n = 3) treated with TGFβ1 and (b) quantitation of the number of αSMA-RFP+ cells per visual fields. (c) Relative Acta2 (αSMA) expression by Q-PCR analysis in bone marrow derived mesenchymal stem cells (MSCs) cultured with and without TGFβ1 stimulation. (d) αSMA-FITC labeling of MSCs from littermate control WT (n = 3) and αSMA-Cre;Tgfbr2f/f mice (n = 3) treated with TGFβ1 at the indicated time and (e) quantitation of the number of αSMA+ cells per visual fields. (f) Immunolabeling for αSMA and Ki67 in fibrotic kidney of WT (n = 5) and αSMACre; Tgfbr2f/f mice (n = 4) and quantitation of αSMA+ and αSMA+/Ki67+ myofibroblasts. (g) Representative Masson Trichrome staining (MTS) of WT and αSMA-Cre;Tgfbr2f/f fibrotic kidneys, and morphometric analysis for relative interstitial fibrosis and tubular atrophy. (h) Immunolabeling and quantitative analysis for F4/80+ macrophages in αSMA-Cre;Tgfbr2f/f non-fibrotic (control) and WT and αSMA-Cre;Tgfbr2f/f fibrotic kidneys. AU: Arbitrary Units. DAPI(blue): nuclei. Scale bar: 50 µm. Data is presented as mean ± s.e.m. t-test, *P < 0.05.
Fig. 4
Fig. 4. NG2+ and Pdgfrb+ pericytes accumulate in the interstitium but do not functionally contribute to fibrosis
(a) Visualization and quantitation of NG2-YFP+ cells in non-fibrotic contralateral (Control, n = 5) and fibrotic mouse kidneys from NG2-YFP transgenic mice (n = 5). (b) Visualization and quantitation of Pdgfrb-RFP+ cells in non-fibrotic contralateral (Control, n = 5) and fibrotic mouse kidneys from Pdgfrb-RFP transgenic mice (n = 5). (c) Immunolabeling for NG2 and related quantitative analyses in non-fibrotic contralateral (Control, n = 5) and fibrotic kidneys from littermate WT (NG2-tk, n = 5) and NG2-tk+ (n = 5) mice. (d) Immunolabeling for Pdgfrb and related quantitative analyses in non-fibrotic contralateral (Control, n = 5) and fibrotic kidneys from littermate WT (Pdgfrb-tk, n = 5) and Pdgfrb-tk+ (n = 5) mice treated with GCV. (e) Representative Masson Trichrome staining (MTS) of non-fibrotic contralateral kidney (Control) and fibrotic kidney (Day 10 post UUO) of indicated experimental groups and respective morphometric analyses. AU: Arbitrary Units. DAPI(blue): nuclei. Scale bar: 50 µm. Data is presented as mean ± s.e.m. t-test, *P < 0.05.
Fig. 5
Fig. 5. Endothelial to Mesenchymal Transition contributes to myofibroblasts in fibrosis
(a) Representative imaging of healthy and fibrotic kidney (Day 10 post UUO) from γGT-Cre;YFPf/f;αSMA-RFP mice: proximal tubules are green (YFP), interstitial myofibroblasts are red (RFP). (b–c) Higher magnification images of fibrotic kidney from γGT-Cre;YFPf/f;αSMA-RFP mice at day 5 post UUO (n = 3), and at day 10 post UUO (n = 5). A star (*) indicates (c, left panel) a double positive (YFP+/RFP+) epithelial cells departing from the tubular basement membrane, and (c, right panel) interstitial double positive (YFP+/RFP+) myofibroblasts. (d–e) Quantitation of double positive tubules (d) and interstitial myofibroblasts (e) in γGT-Cre;YFPf/f;αSMA-RFP mice: non-fibrotic (Control) kidneys and fibrotic kidneys at day 5 and day 10 post UUO. The percentage listed is based on the observed total number of αSMA+ interstitial cells on day 10 post UUO. (f) Representative imaging of healthy contralateral kidney (Control, n = 5) and fibrotic (Day 10 post UUO, n = 5) from Cdh5-Cre;YFPf/f;αSMA-RFP mice and (g) quantitation of double positive interstitial myofibroblasts. The percentage listed is based on the observed total number of αSMA+ interstitial cells on day 10 post UUO. DAPI(blue): nuclei. Scale bar: 50 µm. Data is presented as mean ± s.e.m. t-test, *P < 0.05.

Comment in

Similar articles

Cited by

References

    1. Gabbiani G. The myofibroblast in wound healing and fibrocontractive diseases. The Journal of pathology. 2003;200:500–503. - PubMed
    1. Sugimoto H, Mundel TM, Kieran MW, Kalluri R. Identification of fibroblast heterogeneity in the tumor microenvironment. Cancer Biol Ther. 2006;5:1640–1646. - PubMed
    1. Meran S, Steadman R. Fibroblasts and myofibroblasts in renal fibrosis. Int J Exp Pathol. 2011;92:158–167. - PMC - PubMed
    1. Humphreys BD, et al. Fate tracing reveals the pericyte and not epithelial origin of myofibroblasts in kidney fibrosis. The American journal of pathology. 2010;176:85–97. - PMC - PubMed
    1. Lin SL, Kisseleva T, Brenner DA, Duffield JS. Pericytes and perivascular fibroblasts are the primary source of collagen-producing cells in obstructive fibrosis of the kidney. The American journal of pathology. 2008;173:1617–1627. - PMC - PubMed

Publication types

MeSH terms

Substances