. 2013:3:2118.
doi: 10.1038/srep02118.

Rapid thinning of the Late Pleistocene Patagonian Ice Sheet followed migration of the Southern Westerlies

Affiliations

Rapid thinning of the Late Pleistocene Patagonian Ice Sheet followed migration of the Southern Westerlies

J Boex et al. Sci Rep. 2013.

Abstract

Here we present the first reconstruction of vertical ice-sheet profile changes from any of the Southern Hemisphere's mid-latitude Pleistocene ice sheets. We use cosmogenic radio-nuclide (CRN) exposure analysis to record the decay of the former Patagonian Ice Sheet (PIS) from the Last Glacial Maximum (LGM) and into the late glacial. Our samples, from mountains along an east-west transect to the east of the present North Patagonian Icefield (NPI), serve as 'dipsticks' that allow us to reconstruct past changes in ice-sheet thickness, and demonstrates that the former PIS remained extensive and close to its LGM extent in this region until ~19.0 ka. After this time rapid ice-sheet thinning, initiated at ~18.1 ka, saw ice at or near its present dimension by 15.5 ka. We argue this rapid thinning was triggered by a combination of the rapid southward migration of the precipitation bearing Southern Hemisphere (SH) westerlies and regional warming.


Figures

Figure 1
Figure 1. Location map; Map A, South America and the location of the study area also showing the existing North and South Patagonian Icefields (dark grey) together with the mapped LGM ice sheet (light grey).
Map B is adapted from and shows the modelled ice thickness based on mapped outer limits in the Lago Buenos Aires Lobe. The white box shows the location of the study area and transect that forms the focus of this study (see Figure 2).
Figure 2
Figure 2. Digital elevation model (SRTM) of the Lago Pueyrredón basin showing the study area, transect and reconstructed ice surfaces.
The white lines in the east (upper panel) show previously mapped outer limits, the Hatcher and Rio Blanco moraines. Pink dots show the location of cosmogenic exposure age samples, from mountains Cerro Tamango in the west to Cerro Oportus and Sierra Colorado in the east. The white dotted line shows the location of the transect shown in the cross section. The lower panel shows the transect generated from SRTM data with x15 vertical exaggeration (see Figure 1 for location). Sampled boulders are shown with exposure ages (circles show 10Be, triangles show both 10Be and 26Al exposure ages).
Figure 3
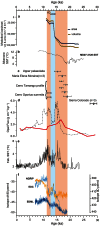
Figure 3. Deglacial records illustrating the rapid thinning of the Patagonian Ice Sheet at 47.1°S against warming and rising atmospheric CO2 in Antarctica, upwelling in the Southern Ocean and NGRIP ice core record.
(a) Time-series of ice sheet volume and area during deglaciation from the optimum LGM extent at 23,500 through to 11,000 years driven by ELA re-scaled from the Vostok temperature reconstruction Periods of warming in Antarctica are highlighted in red, while the Antarctic Cold Reversal (ACR) is highlighted in blue and the Younger Dryas (YD) is in grey. (b) Alkenone-based SST reconstruction from core MD07-3128 (53°S). (c) Accepted exposure ages for ice sheet stages, marking the changing volume and extent of the ice sheet in the Lago Pueyrredón basin and the Chacabuco Valley calculated with the independently derived NZ production rate. (d) Opal flux from ocean cores TN057-13PC (51°S, 4°E) and NBP9802-6 (62°S, 169°W) as a proxy for upwelling in the Southern Ocean. Opal flux and February SST are plotted on the published age model for TN057-13PC. (e) February SST estimated by applying the modern analog technique to diatom species assemblages extracted from TN057-13PC. (f) Ice isotope chronologies for the EPICA Dome C (EDC) and EPICA Draunning Maud Land (EDML) core (light and dark blue respectively), and North Greenland Icecore Project (NGRIP) core (orange).

References

    1. Denton G. H. et al. The Last Glacial Termination. Science 328(5986), 1652–1656 (2010). - PubMed
    1. Sime L. C. et al. Southern Hemisphere westerly wind changes during the Last Glacial Maximum: model-data comparison. Quat. Sci. Rev. 64, 104–120 (2013).
    1. Clark P. U. et al. The Last Glacial Maximum. Science 325(5941), 710–714 (2009). - PubMed
    1. Denton G. H. et al. Interhemispheric linkage of paleoclimate during the last glaciation. Geogr. Ann. 81A(2), 107–153 (1999).
    1. Schaefer J. M. et al. Near-synchronous interhemispheric termination of the last glacial maximum in mid-latitudes. Science 312(5779), 1510–1513 (2006). - PubMed

LinkOut - more resources