. 2013 Sep;22(9):1174-82.
doi: 10.1002/pro.2302. Epub 2013 Jul 22.

Ionic strength-dependent conformations of a ubiquitin-like small archaeal modifier protein (SAMP1) from Haloferax volcanii

Affiliations

Ionic strength-dependent conformations of a ubiquitin-like small archaeal modifier protein (SAMP1) from Haloferax volcanii

Kaiqin Ye et al. Protein Sci. 2013 Sep.

Abstract

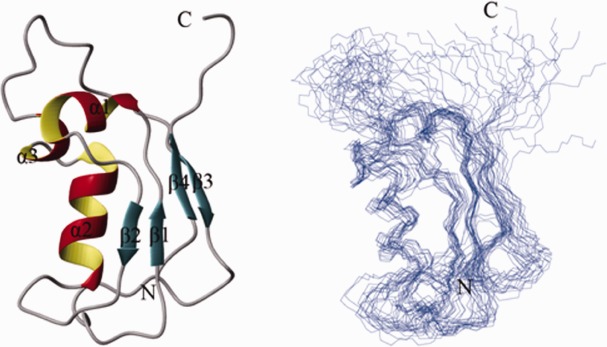
Eukaryotic ubiquitin and ubiquitin-like systems play crucial roles in various cellular biological processes. In this work, we determined the solution structure of SAMP1 from Haloferax volcanii by NMR spectroscopy. Under low ionic conditions, SAMP1 presented two distinct conformations, one folded β-grasp and the other disordered. Interestingly, SAMP1 underwent a conformational conversion from disorder to order with ion concentration increasing, indicating that the ordered conformation is the functional form of SAMP1 under the physiological condition of H. volcanii. Furthermore, SAMP1 could interact with proteasome-activating nucleotidase B, supposing a potential role of SAMP1 in the protein degradation pathway mediated by proteasome.

Keywords: Haloferax volcanii; NMR; SAMP1; protein folding; ubiquitin-like protein.


Figures

Figure 1
Figure 1
A: Multiple sequence alignment of SAMP1, SAMP2, Pup, ubiquitin and other β-grasp proteins. Alignment was performed with ClustalW2 and BOXSHADE version 3.2 (http://www.ch.embnet.org/software/BOX_form.html). Identical and similar amino acids are shaded in black and grey, respectively. HvSAMP1, Haloferax volcanii SAMP1; HvSAMP2, Haloferax volcanii SAMP2; HsUbiquitin, Homo sapiens Ubiquitin; HsUrm1, Homo sapiens Urm1; EcMoaD, Escherichia coli MoaD; EcThiS, Escherichia coli ThiS; MtPup, Mycobacterium tuberculosis Pup. B: 1H-15N HSQC spectrum of SAMP1 under low ionic condition (25 mM NaH2PO4, 100 mM NaCl, 2 mM EDTA, pH 6.7), peaks of SAMP1-d are labeled with “*”. [Color figure can be viewed in the online issue, which is available at http://wileyonlinelibrary.com.]
Figure 2
Figure 2
Chemical shift index (CSI) plots were tabulated based on chemical shifts of Hα, Cα, Cβ, CO of SAMP1 (upper for SAMP1-o, lower for SAMP1-d).
Figure 3
Figure 3
Solution structures of SAMP1-o under low ionic condition. Ribbon structure of a representative conformer of SAMP1-o with the secondary structure elements highlighted (left) and ensemble of 20 lowest-energy conformers calculated for SAMP1-o (right). [Color figure can be viewed in the online issue, which is available at http://wileyonlinelibrary.com.]
Figure 4
Figure 4
15N-HSQC spectra of SAMP1 in different salt concentrations. The salt concentrations are 0.1M, 1M, 2M, and 3M of NaCl, respectively. Note that all the weakened and disappeared resonances of SAMP1 belong to the disordered conformation and are distributed between 8.0 and 8.7 ppm of HN. [Color figure can be viewed in the online issue, which is available at http://wileyonlinelibrary.com.]
Figure 5
Figure 5
15N-HSQC spectra of SAMP1 in different salt concentrations from high to low ionic salt concentration. 1H-15N HSQC spectrum of SAMP1 under 1M NaCl. 1H-15N HSQC spectrum of SAMP1 under 0.1M NaCl which is dialyzed from SAMP1 under 1M NaCl. [Color figure can be viewed in the online issue, which is available at http://wileyonlinelibrary.com.]
Figure 6
Figure 6
A: 1H-15N HSQC spectra of SAMP1 titrated with unlabeled PanB under high ionic condition at various molar ratios. B: The selected residues of SAMP1 with chemical shift or peak intensity significantly changed in the perturbation. Red (1:0), blue (1:2) and green (1:4). C: Plots of the chemical shift changes of three well-resolved amide resonances against PanB concentrations. Each dissociation constant is determined by fitting the data to a single-site ligand-binding model. [Color figure can be viewed in the online issue, which is available at http://wileyonlinelibrary.com.]
Figure 7
Figure 7
The interactions between SAMP1 and PanB measured by ITC assay. The cell contains 250 µL 50 µM SAMP1 and syringe contains 60 µL 2 mM PanB (upper panel). The lower panel shows the heat differences obtained from 20 injections of PanB after baseline correction and the integrated binding curve is generated according to the one site binding model.

Similar articles

Cited by

References

    1. Hochstrasser M. Origin and function of ubiquitin-like proteins. Nature. 2009;458:422–429. - PMC - PubMed
    1. Morris JR. More modifiers move on DNA damage. Cancer Res. 2010;70:3861–3863. - PMC - PubMed
    1. Haas AL, Siepmann TJ. Pathways of ubiquitin conjugation. FASEB J. 1997;11:1257–1268. - PubMed
    1. Tanaka K, Suzuki T, Chiba T. The ligation systems for ubiquitin and ubiquitin-like proteins. Mol Cells. 1998;8:503. - PubMed
    1. Burroughs AM, Balaji S, Iyer LM, Aravind L. A novel superfamily containing the beta-grasp fold involved in binding diverse soluble ligands. Biol Direct. 2007;2:4. - PMC - PubMed

Publication types

MeSH terms

LinkOut - more resources