. 2013 Nov;521(16):3614-65.
doi: 10.1002/cne.23404.

Global view of the functional molecular organization of the avian cerebrum: mirror images and functional columns

Affiliations

Global view of the functional molecular organization of the avian cerebrum: mirror images and functional columns

Erich D Jarvis et al. J Comp Neurol. 2013 Nov.

Abstract

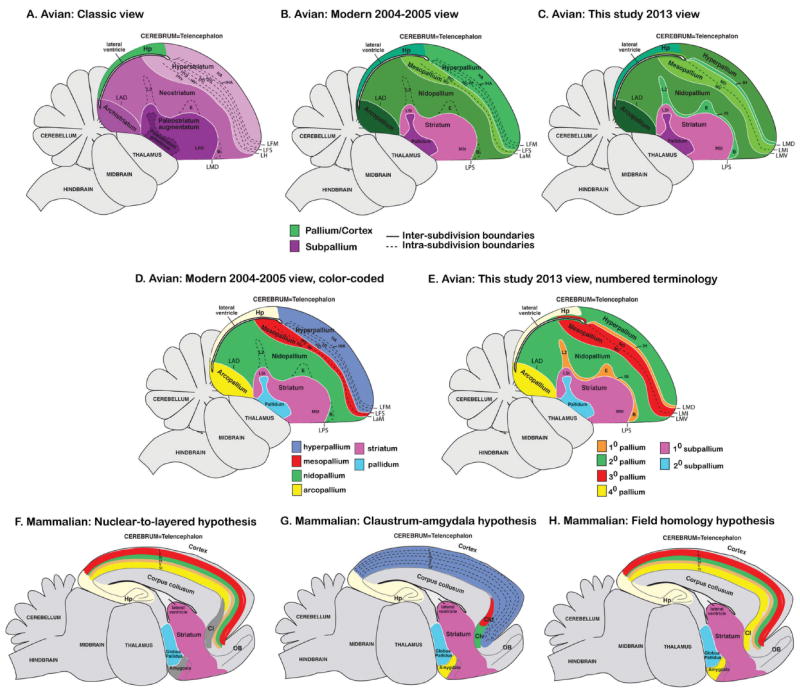
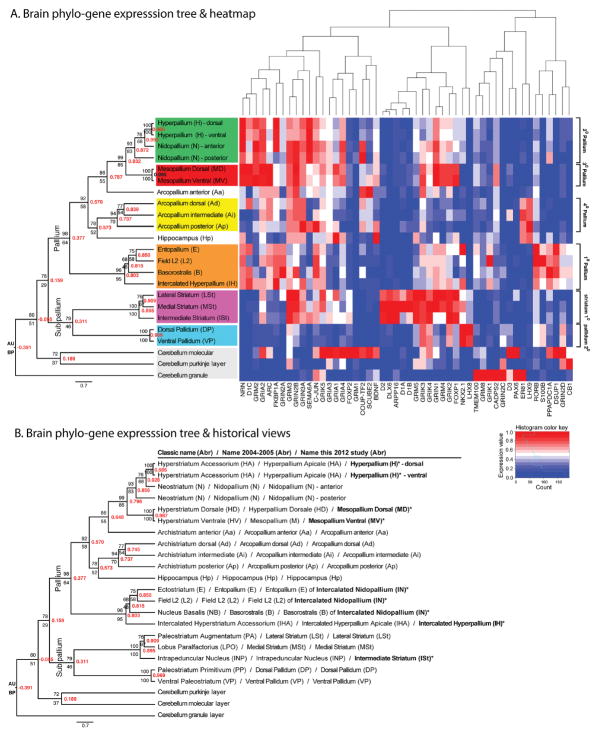
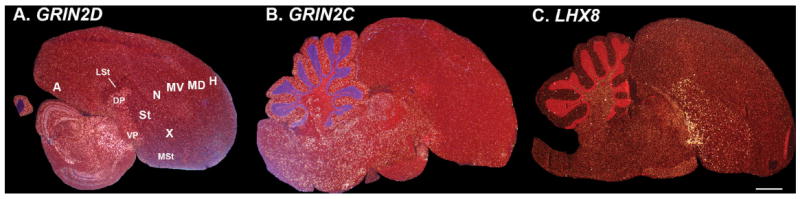
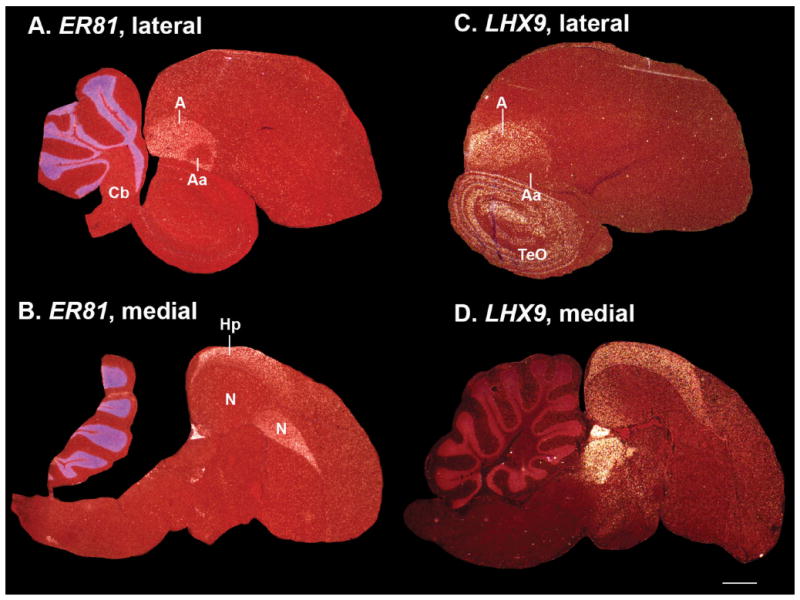
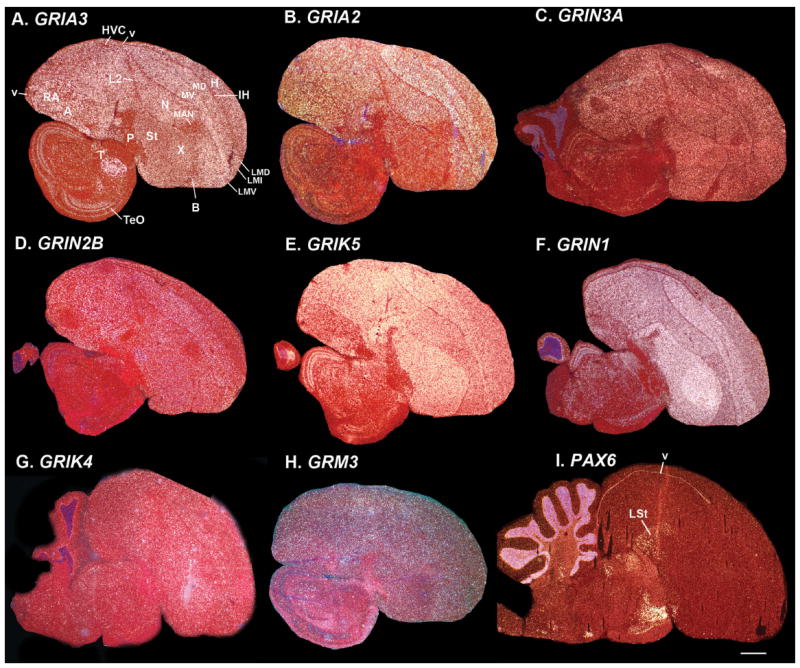
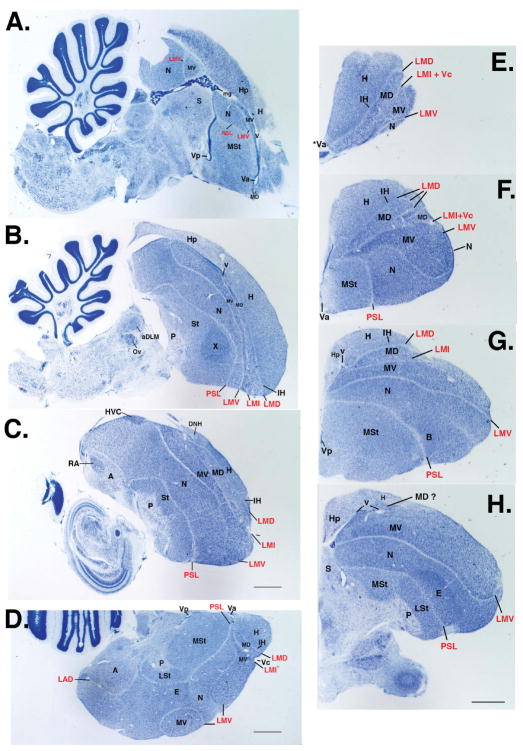
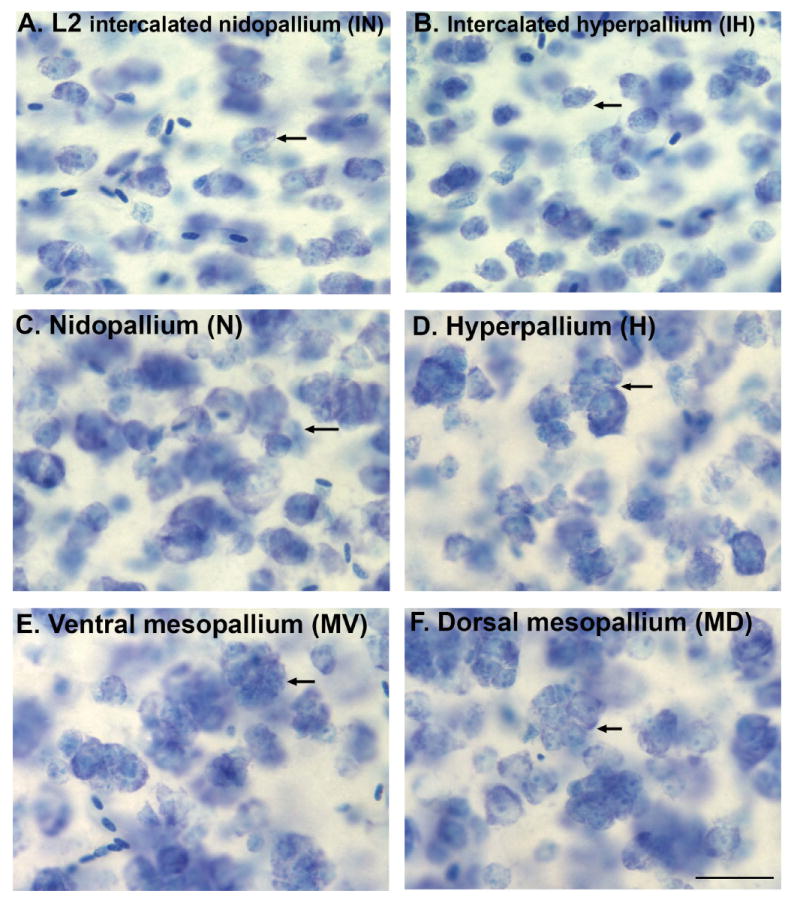
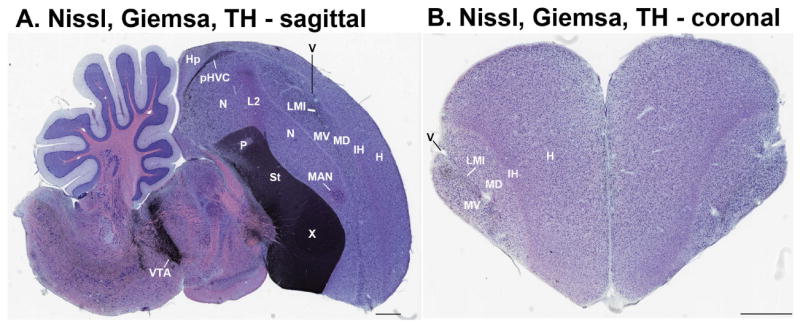
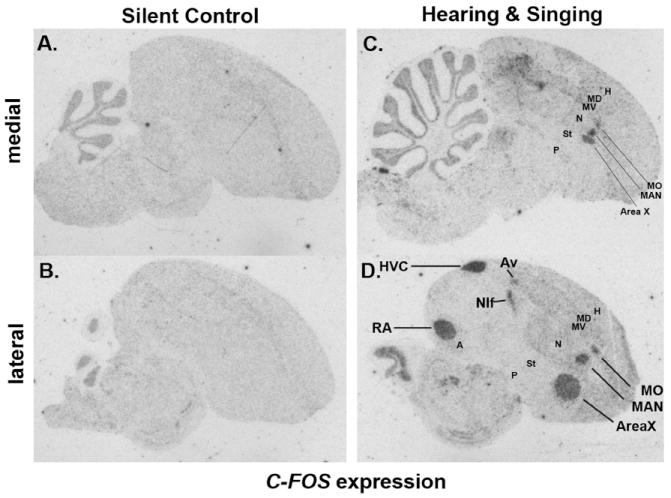
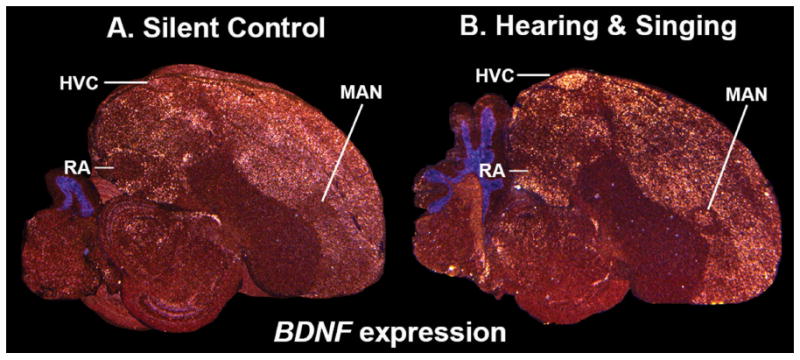
Based on quantitative cluster analyses of 52 constitutively expressed or behaviorally regulated genes in 23 brain regions, we present a global view of telencephalic organization of birds. The patterns of constitutively expressed genes revealed a partial mirror image organization of three major cell populations that wrap above, around, and below the ventricle and adjacent lamina through the mesopallium. The patterns of behaviorally regulated genes revealed functional columns of activation across boundaries of these cell populations, reminiscent of columns through layers of the mammalian cortex. The avian functionally regulated columns were of two types: those above the ventricle and associated mesopallial lamina, formed by our revised dorsal mesopallium, hyperpallium, and intercalated hyperpallium; and those below the ventricle, formed by our revised ventral mesopallium, nidopallium, and intercalated nidopallium. Based on these findings and known connectivity, we propose that the avian pallium has four major cell populations similar to those in mammalian cortex and some parts of the amygdala: 1) a primary sensory input population (intercalated pallium); 2) a secondary intrapallial population (nidopallium/hyperpallium); 3) a tertiary intrapallial population (mesopallium); and 4) a quaternary output population (the arcopallium). Each population contributes portions to columns that control different sensory or motor systems. We suggest that this organization of cell groups forms by expansion of contiguous developmental cell domains that wrap around the lateral ventricle and its extension through the middle of the mesopallium. We believe that the position of the lateral ventricle and its associated mesopallium lamina has resulted in a conceptual barrier to recognizing related cell groups across its border, thereby confounding our understanding of homologies with mammals.

Keywords: amygdala; basal ganglia; brain evolution; brain organization; brain pathways; claustrum; cortex; forebrain; immediate early genes; motor behavior; neural activity; neurotransmitter receptors; pallidum; pallium; primary sensory; striatum.


Figures

Figure 1
Figure 1
Classical and modern views of avian cerebral organization. Shown are sagittal views of a songbird (zebra finch) brain with subdivisions colored-coded according to the meaning of the names given to those brain regions in different nomenclature schemas over time. A: Classic view of avian brain relationships according to popular terminology given to those regions (Edinger, 1885, 1908; Ariëns Kappers et al., 1936), although past authors had different opinions about which brain regions are pallium versus subpallium. B: Modern 2004–2005 consensus view of avian brain relationships according to the conclusions of the Avian Brain Nomenclature Forum (Reiner et al., 2004b; Jarvis et al., 2005). C: Revised modern view according to this study. D: Higher contrast color-coded scheme for the modern 2004–2005 view to highlight contrast of pallial regions with each other. E: Higher contrast color-coded scheme for the view presented in this study to highlight the alternative new numbered terminology based on shared gene expression profiles and connectivity. F: Color-coded scheme of the rodent brain according to the nuclear-to-layered hypothesis of homology with the avian brain (D). G: Color-coded scheme of the rodent brain according to the claustrum-amygdala hypothesis of homology with the avian brain (D). H: Color-coded scheme of the rodent brain according to the field hypothesis of homology with the avian brain proposed in this study (E). For all images, solid white lines are lamina (relatively cell sparse zones) that separates subdivisions; dashed lines divide regions within a subdivision, whether a lamina is present or not. Comparison of spelled out names with abbreviations for each of the views is shown in Table 2 and Fig. 3B.
Figure 2
Figure 2
Camera lucida drawings of the major subdivisions of the avian brain based on the zebra finch. Drawings are based on FoxP1 images in Supporting folder F1, with additional information from all other genes, Nissl, and fiber staining. A–E: Medial to lateral sagittal series. F–O: Anterior to posterior coronal series. Solid lines divide brain subdivisions with both distinct lamina and gene expression profiles. Dashed line is the LMI lamina between the dorsal (MD) and ventral (MV) mesopallium. Dotted lines are brain nuclei within brain subdivisions; the song nuclei (HVC, RA, MAN, Av, MO, and Area X) are unique to vocal learners; v, the ventricular space; *, regions quantified for brain phylo-gene expression tree analyses. Nomenclature is that proposed in this study. Boundaries of some brain subdivisions differ from the available zebra brain atlas (Nixdorf-Bergweiler and Bischof, 2007), as the atlas was based only on Nissl staining, which is more difficult for identifying boundaries than gene expression profiles. Scale bar = 1 mm.
Figure 3
Figure 3
Brain phylo-gene expression tree. A: Tree (left) and gene expression heatmap (right) showing molecular relationships of 23 brain regions of the zebra finch based on 50 genes. The six major telencephalic subdivisions revealed by the tree are color-coded. The tree was generated with Distance-Correlation (red values inside nodes) on normalized gene expression data, followed by Biedl’s ordering of leaves according to similarity of gene expression vectors. Also shown are the Approximately Unbiased (AU) probability values above the nodes and Bootstrap Probabilities (BP) below the nodes for 1,000 replicates using Pvclust. Far right is the more global numbered pallial and sub-pallial terminologies based on this tree and known connectivity. The gene expression heatmap shows relative expression levels for each gene scaled between 0–1 (red, higher than the average for that region relative to other regions; blue, lower than the average). Above the heatmap is the tree relationship of the genes based on brain expression. B: The same tree as in (A), but with all three nomenclatures compared: the classical, 2004–2005 revisions, and this study. Bold text are newly defined terms in this study.
Figure 4
Figure 4
Phylo-gene expression trees using Pvclust on different similarity measures (Distance-Correlation vs. Euclidean-Distance) and processing of gene expression data (normalized vs. discretized). A: Distance correlation tree using normalized gene expression data scaled between 0–1. B: Distance-Correlation tree using discretized gene expression data into three levels (0, 1, 2). C: Euclidean-Distance tree using normalized gene expression data scaled between 0–1. D: Euclidean distance tree using discretized gene expression data into three levels (0, 1, 2). Values inside nodes represent the strongest (1) to the weakest (21) similarity; values outside are bootstrap supports (BS, green) and approximate unbiased (AU, red) probabilities. Branches boxed in red represent the deepest node that brings regions together at 95–100 AU support (equivalent to P < 0.05).
Figure 5
Figure 5
Effect on phylo-gene expression tree topology of removing one or up to 10 genes with distinctive brain subdivision expression profiles. A: Removal of a mesopallium enriched gene (ARC). B: Removal of an arcopallium-hippocampus enriched gene (ER81). C: Removal of a nidopallium enriched gene (COUP-TF2). D: Removal of an intercalated pallium enriched gene (S100B). E: Removal of a nidopal-lium+hyperpallium gene (PPAPDC1A). F: Removal of 10 genes (those removed in panels A–E, plus SCUBE2 [mesopallium], FOXP2 [stria-tum], GRIA1 [mesopallium+striatum], GRM8 [pallium], TMEM100 [pallium+pallidum]). Values inside nodes represent the strongest (1) to the weakest (21) similarity; values outside are bootstrap supports (BS, green) and approximate unbiased (AU, red) probabilities. Branches boxed in red represent the deepest node that brings regions together at 95–100 AU support (equivalent to P < 0.05).
Figure 6
Figure 6
Examples of pallium enriched genes. A: Neuritin (NRN) is expressed at baseline in most pallial regions except the intermediate arcopallium (Ai). B: Brain derived neurotrophic factor (BDNF) is expressed at baseline in most nonprimary sensory pallial regions. C: Dopa-mine receptor 1C (D1C) is expressed at high levels in most pallial regions, except for the pallial song nuclei (HVC, RA, LMAN). D: Glutamate receptor metabotrophic 2 (GRM2) is expressed throughout the pallium, with lower levels in caudal pallial regions. E: Glutamate receptor ionotropic AMPA 4 (GRIA4) is expressed throughout the pallium, with lower levels in the arcopallium and song nucleus HVC. F: Glutamate receptor metabotrophic 8 (GRM8) is expressed throughout the pallium, with lower expression in the caudal nidopallium. G: Glutamate receptor ionotropic NMDA type 2A (GRIN2A) is expressed in all pallial regions along with localized expression in one basal ganglia region, the lateral striatum (LSt); it is also higher in all major song nuclei (HVC, RA, LMAN, and Area X). H: Transmembrane protein 100 (TMEM100) is expressed in all pallial regions and also in one basal ganglia population, the pallidum (P). Sections are mid-sagittal brain of male, quiet control, zebra finches. Brain region labels are shown only in panels A and C, in order to allow visualization of the signal without text interference in the other panels. White, mRNA signal. Red, cresyl violate label. Color differences are due to different batches of cresyl violate used. Grayscale image of TMEM100 is from x-ray film; all others are from emulsion-dipped slides. Sets of serial sections are in the Supporting database folder. Scale bar = 1 mm.
Figure 7
Figure 7
Examples of striatum enriched genes. A: Dopamine 1A (D1A) receptor is expressed in striatal regions, with higher expression in the Area X song nucleus. B: Dopamine 1B (D1B) receptor is a paralog gene with a similar expression pattern, but with expression also in the posterior arcopallium (Ap). C: Dopamine 2 (D2) receptor has a similar pattern, with expression also in the anterior arcopallium (Aa) and a gradient of low to higher levels in MV and MD towards the LMI lamina. D: D1B receptor expression in a section more lateral to that in panel (B) showing expression in the intrapeduncular nucleus renamed here as intermediate striatum (ISt). E: Forkhead box protein 2 (FOXP2) transcription factor expression enriched in the striatum. F: Distal-less homeobox 6 (DLX6) transcription factor expression enriched in the striatum. G: Glutamate receptor metabotropic 5 (GRM5) expression enriched the striatum, lower expression in Area X, and some detectable expression in the caudal nidopallium. H: cAMP regulated phosphoprotein 16000 (ARPP16) expression enriched in the striatum. Grayscale image of ARPP16 is from x-ray film; all others are from emulsion-dipped slides. Sets of serial sections are in the Supporting database folder. Scale bar = 1 mm.
Figure 8
Figure 8
Examples of pallidum enriched genes. A: Glutamate receptor ionotropic NMDA subunit 2D (GRIN2D) enriched in the dorsal and ventral pallial regions. B: Glutamate receptor ionotropic NMDA subunit 2C (GRIN2C) shows a similar pattern. These two genes are also enriched in the brainstem. C: LIM homeobox 8 (LHX8) transcription factor is enriched in the pallidum, particularly ventral pallidum, and is expressed at high levels in scattered cells of the striatum. More complete sets of serial sections are in the Supporting database folder. Scale bar = 1 mm.
Figure 9
Figure 9
Examples of mesopallium (30-pallium) enriched genes. A: Activity-regulated cytoskeleton-associated gene (ARC) is expressed at high levels in the mesopallial regions (MD and MV) relative to all other regions at baseline, in quiet control animals. B: Calcium-dependent secretion activator 2 (CADPS2) has selectively enriched expression in the mesopallium, less but specific expression in the arcopallium (A), and specialized expression in several song nuclei (HVC, Area X). C: Dopamine 3 (D3) receptor has a similar pattern as CADPS2, but with arcopallial expression restricted to its intermediate part (Ai). D: Forkhead box protein 1 (FOXP1) is enriched equally in the mesopallium and striatum (St). E: Glutamate receptor ionotropic AMPA 1 (GRIA1) has a similar pattern as FOXP1, but with greater differential expression in song nuclei. F: Glutamate receptor ionotropic kainate 3 (GRIK3) also has a similar pattern as FOXP1, but with comparable arcopal-lium expression (minus expression in the RA song nucleus). G: Glutamate receptor ionotropic kainate 2 (GRIK2) has similar mesopallial and striatal enrichment. H: Glutamate receptor metabotropic 4 (GRM4) expression is also similar, but in the arcopallium higher expression was restricted to RA. Sets of serial sections are in the Supporting database folder. Scale bar = 1 mm.
Figure 10
Figure 10
Examples of hyperpallium+nidopallium (20-pallium) enriched genes. A: Phosphatidic acid phosphatase 2 domain containing 1A (PPAPDC1A) has comparable enriched expression in the hyperpallium (H) and nidopallium (N). B: Semaphorin-6A (SEMA6A) axon guidance molecule has similar expression, but without enriched expression in the primary sensory fields (i.e., L2). C: Cellular Jun (C-JUN) oncogene has a similar pattern, but with less contrast in expression levels, and specialized lower expression in the Area X song nucleus relative to the surrounding striatum (St). D: NK2 homeobox 1 (NKX2.1) transcription factor known to be expressed in GABAergic neurons has a similar profile, but with comparable expression throughout the striatum and lower expression in the posterior nidopallium. E: FK506 binding protein 1A (FKBP1A) also has enriched expression in the hyperpallium and anterior nidopallium. F: Glutamate receptor metabotropic 1 (GRM1) has an inverse pattern to NKX2.1 and FKBP1A, being specifically enriched in the posterior nidopallium. The former three genes contribute to the closer association of the hyperpallium and anterior nidopallium relative to the posterior nidopallium. G: Chicken ovalbu-min upstream promoter transcription factor 2 (COUP-TF2) shows the highest enrichment in the nidopallium (and arcopallium, see Supporting F1) separate from the hyperpallium. H: Signal peptide, CUB, and EGF-like domain-containing protein 1 precursor (SCUBE1) shows an inverse pattern, with isolated cells showing higher expression in the hyperpallium than the nidopallium. Grayscale image of FKBP1A is from x-ray film; the SCUBE1 image is from a nonradioactive in situ hybridization and grayscale inverted from the original database version generated by Mello and Lovell http://www.zebrafinchatlas.org/; all others are from emulsion-dipped slides. Sets of serial sections are in the Supporting database folder. Scale bar = 1 mm.
Figure 11
Figure 11
Examples of intercalated pallium (10-pallium) enriched genes. A: Retinoid-related orphan receptor beta (ROR-β) enriched in primary sensory cell populations. B: Glutamate receptor ionotropic kainate 1 (GRIK1) has a similar expression profile, but with a gradient of high to low expression from the primary sensory populations into the adjacent nidopallium and hyperpallium, and in addition enriched expression in the RA song nucleus and the granular layer of the cerebellum. C: S100 calcium binding protein B (S100B) has a similar expression profile, but without a gradient, and also enriched in the pallidum and the four major song nuclei. D–F: Medial to lateral series of dual specificity phosphatase 1 (DUSP1) expression showing induced levels in the primary cell populations, IN (L2, E, B) and IH, of an active animal in the morning from the aviary (hearing songs, seeing lights come on, and moving). G,H: Medial and lateral section of canna-binoid receptor 1 (CB1) protein expression (gray-black label) showing enrichment in the primary sensory cell populations, as well as the four major song nuclei. DUSP1 images overlap with those shown in (Horita et al., 2010); CB1 images are courtesy of Ken Soderstrom (Soderstrom et al., 2004). Sets of serial sections are in the Supporting database folder. Scale bar = 1 mm.
Figure 12
Figure 12
Example of arcopallium (40-pallium) enriched genes. A,B: Ets-related 81 (ER81) transcription factor is enriched in the arcopal-lium (except its Aa; panel A) and hippocampus (panel B); it is also enriched in the cerebellum granular layer. C,D: LIM home domain 9 (LHX9) has a similar arcopallium (C) and hippocampus (D) expression pattern, but is expressed in the tectum and thalamus without cerebellum enrichment (also see Supporting F1). Sets of serial sections are in the Supporting database folder. Scale bar = 1 mm.
Figure 13
Figure 13
Broad telencephalic expressed genes. A: Glutamate receptor ionotropic AMPA 3 (GRIA3) is more uniformly expressed across most telencephalon cell populations, except in the primary sensory intercalated pallium populations (IH and IN) and the pallidum (P). B: Glutamate receptor ionotropic AMPA 2 (GRIA2) has a similar pattern as GRIA3, except the medial striatum has lower expression. C: Glutamate receptor ionotropic NMDA 3A (GRIN3A) has a similar pattern, except that IH has similar expression as the rest of the telencephalon. D: Glutamate receptor ionotropic NMDA 2B (GRIN2B) has a similar pattern, except that IN has similar expression as the rest of the telen-cephalon. E: Glutamate receptor ionotropic kainate 5 (GRIK5) has a similar pattern as GRIN1, except it is much lower in the pallidum. F: Glutamate receptor ionotropic NMDA 1 (GRIN1) is the main subunit to which most NMDA subunits bind, and consistent with this, it is expressed at high levels in all six major telencephalic populations. G: Glutamate receptor ionotropic kainate 4 (GRIK4) also has similar pattern as GRIN1, except it has variable expression in more lateral regions (see Supporting F1). H: Glutamate receptor metabotropic 3 (GRM3) also has a similar pattern as GRIN1, except with lower expression in Area X and some nuclei of IN (L2 and E, see Supporting F1). I: Paired box gene 6 (PAX6) transcription factor in contrast is not expressed throughout most of the telencephalon, except low levels in the telencephalic ventricle zone and LSt of the striatum. Sets of serial sections are in the Supporting database folder. Scale bar = 1 mm.
Figure 14
Figure 14
Nissl thionin staining. Zebra finches: A–C: Midline to lateral sagittal serial sections showing major lamina, telencephalic ventricle, and cell histology differences. D: Horizontal section cut at the level of the arcopallium. E–H: Coronal serial sections from anterior to posterior locations showing the shapes of the MD and MV regions and the associated lamina. For all images, brain subdivisions and ventricle are labeled in black text; lamina are labeled in red text. Scale bars = 1 mm.
Figure 15
Figure 15
Nissl thionin staining for pallial regions. A: Higher magnification of a zebra finch sagittal section that includes the posterior nidopallium, mesopallium, and hyperpallium regions around the LMI lamina and lateral ventricle. B: Higher magnification of the same section, but in the anterior forebrain. C: Higher magnification of a coronal section of the same regions in the posterior forebrain. D: Higher magnification of the medial portion of the arcopallium. E: Higher magnification of the central portion of arcopallium showing most of its subdivisions and the RA song nucleus. F: Higher magnification of a lateral portion of arcopallium. G: Higher magnification of a ring dove sagittal section at the same level in panel A for the zebra finch brain. H: Higher magnification of a ring dove coronal section brain at a more posterior level than panel F for the zebra finch brain. The dove brain sections are thinner (10 μm) than the zebra finch sections (40 μm), and therefore the subdivision boundaries are not as clearly seen in digital photographs. For all images, brain subdivisions and ventricle are labeled in black text; lamina are labeled in red text. Scale bars = 500 μm.
Figure 16
Figure 16
High magnification Nissl staining showing clusters of cells. A,B: Intercalated pallium regions showing organization of more isolated cells. C,D: Hyperpallium and nidopallium regions showing shared higher clustering of cells. E,F: Dorsal and ventral mesopallium regions showing a further increased clustering of cells. Arrows point to representative clusters of cells. Scale bar = 200 μm.
Figure 17
Figure 17
Cell density and clustering quantifications. A: Relative cell density measures of representative brain regions. Boxplots show the average, 25th and 75th percentile, and error bars show the full range. *P < 0.05, ANOVA, n = 4 samples, showing only comparisons between MD and other dorsal pallial regions. B–D: Cell cluster distributions grouped according to similar clustering profiles and color-coded according to location in the dorsal (red) or ventral (blue) pallium. E,F: The same data from panels B-D, but now grouped according to location in the ventral (E) or dorsal (F) pallium and color-coded according to similar profiles. G: Cluster profile for two striatal regions for comparison. H: Cluster profile of the dorsal pallidum for comparison. D = the maximum distance between the cumulative distributions, and P = the corresponding probability of a Kolmogorov-Smirnov Comparison Test, hypothesizing either higher or lower distributions.
Figure 18
Figure 18
Nissl+Giemsa+tyrosine hydroxylase triple label. A: Example section used to create 3D drawings of brain regions in the sagittal plane. Note high tyrosine hydroxylase (TH) fiber labeling (black, from VTA neurons) in the striatum (St), the MAN and HVC song nuclei, and caudal LMI lamina between MV and MD, and higher Giemsa staining (pink) in the IN (shown here for L2) and IH. B: Example section through the anterior pole of the telencephalon used to create 3D drawings in the coronal plane. Note the pockets of ventricular space or large blood vessel openings in or around the LMI lamina between MD and MV, and higher Giemsa staining in the IH. Nissl cell labeling is purple in color. Sections are from the Karten et al. (2008 Karten et al. (2013) zebra finch Nissl stain atlas. A set of serial sections is in the Supporting database folder. Scale bars = 1 mm.
Figure 19
Figure 19
Darkfield light reflection of fibers showing lamina. A: Mid-sagittal section showing four major telencephalic lamina (LMD, LMI, LMV, and PSL) with fibers (white). B–E: Medial to lateral sagittal series showing overall organization of lamina. F–I: Higher magnification of the medial to lateral series of areas that include posterior nidopallium, mesopallium, and hyperpallium around the LMI lamina and lateral ventricle. J–M: Higher magnification of the same medial to lateral series showing the anterior regions. Laminae are labeled in white font; brain subdivisions are labeled in black font. Scale bars = 1 mm.
Figure 20
Figure 20
Myelin fiber staining in lamina. A–D: Medial to lateral sagittal series of myelin stained sections (dark brown). Laminae are labeled with red font; all other regions are labeled with black font. Images courtesy of Karten et al. (2008 Karten et al. (2013).
Figure 21
Figure 21
Cell population gene expression continuities. A: Medial section with FOXP1 expression showing the continuity of expression around LMI connecting the dorsal (MD) and ventral (MV) mesopallium. B: Higher magnification of the anterior FOXP1 expression continuity around the LMI lamina connecting MD and MV. C: Higher magnification of the posterior regions of FOXP1 expression showing continuation of MD above the ventricle and the MV below the ventricle, starting at the junction (J) where LMI meets with the ventricle (v). D: Medial section with PPAPDC1A expression showing a thin posterior strip of continuity of expression around the ventricle connecting the hyperpal-lium (H) and nidopallium (N). E: Higher magnification of the strip of PPAPDC1A continuity from panel D. F: Lateral section with PPAPDC1A expression showing an increase in the thickness of the posterior strip of continuity of expression around the ventricle connecting H and N. G: Higher magnification of the strip of PPAPDC1A continuity from panel F. The mesopallial regions where FOXP1 is expressed (see Fig. 7I) is devoid of PPAPDC1A expression. H: Monoamine oxidase B (MOAB) mRNA expression, showing enrichment in the ventricle zone and adjacent LMI lamina between MD and MV, at the similar medial position of the sections in panels A and D. I: Lateral section with MOAB label, showing lack of high expression in the region of PPAPDC1A continuity between the H and N at a similar lateral position of the section in panel F. Grayscale images of MOAB is from x-ray film; all others are from emulsion-dipped slides. Sets of serial sections are in the Supporting database folder. Scale bars = 1 mm.
Figure 22
Figure 22
Cell population gene expression continuities and convergence. A–C: Posterior to anterior coronal series of PAPPDC1A expression in a male zebra finch, showing the hyperpallium and nidopallium region of continuity (A,B) and the anterior ventricle zone region where the hyperpallium, nidopallium, and striatum converge around the LMI lamina (C). D: FOXP1 expression in a horizontal section of a male zebra finch, showing enriched expression in the striatum and mesopallium, and convergence of each of these regions at the ventricle along the midline (arrow). E: Adjacent horizontal section hybridized with PPAPDC1A showing a complementary pattern, and verifying convergence of all non-arcopallium labeled regions at the ventricle (arrow). F: Adjacent section hybridized with LHX9 showing that the arcopal-lium (A) does not converge at the same ventricle region. Also shown is low label in the anterior arcopallium (Aa). Sets of serial sections are in the Supporting database folder. Scale bar = 1 mm.
Figure 23
Figure 23
3D reconstructions of brain subdivisions. A: Lateral-to-anterior hemi-profile showing intercalated pallium regions (orange) relative to the position of the striatum (purple). The brain surface is shown in yellow shadow. B: Same brain regions with the nidopallium added (green), facing from the lateral side of the hemisphere. C: Lateral-anterior hemi-profile showing continuity of the nidopallium (N, light green) with the hyperpallium (H, dark green). D: Lateral-anterior bilateral-profile showing the dorsal (MD, dark purple) and ventral (MV, red) mesopallium. Note two bulges of the MV that fit inside the two grooves of the nidopallium in (C). Arrows, regions of continuity between dorsal and ventral pallial regions with similar gene expression profiles. E: Medial to lateral reconstructions (sagittal sections) showing the four major song nuclei in one hemisphere. White, posterior pathway song nuclei; orange, anterior pathway song nuclei. F: Anterior to posterior reconstruction (coronal sections) showing the four major song nuclei in both hemispheres. Rotating movies of panels A–F are in the Supporting movies.
Figure 24
Figure 24
Brain subdivision gene expression profiles across avian species. A: FOXP1 expression in pigeon, mid-sagittal section, labeling the mesopallial subdivisions and striatum. B: FOXP1 expression in Japanese quail, medial section. C: FOXP1 expression in budgerigar brain, mid-sagittal section. D: FOXP1 expression in song sparrow, mid-sagittal section. E: FOXP1 expression in Anna’s hummingbird, mid-sagittal section. F: COUP-TF2 expression in pigeon, medial section, labeling the nidopallium. G,H: ROR-b expression in adjacent medial section (G) and a lateral section (H) of pigeon brain, labeling the intercalated nidopallium regions (L2, E, and B). I: ER81 expression in pigeon brain, far lateral section, labeling the arcopallium. Scale bar = 1 mm.
Figure 25
Figure 25
Extent of mesopallium in ring dove brain. Part I. A–D: FOXP1 expression in a medial to lateral sagittal series, showing label in relatively large mesopallial regions (MD and MV). Lines are approximate locations of the coronal sections in a–f. Part II. a–f: Coronal anterior to posterior series of sections from the other hemisphere of the same animal. Lines are approximate locations of the sagittal sections in A–D. Scale bars = 1 mm.
Figure 26
Figure 26
Higher magnification of sagittal sections of the anterior telencephalon showing the thin strip of FoxP1 mesopallium continuity that wraps around the anterior pole of LMI connecting MD and MV in five species that span the neoaves phylogeny. A: Pigeon. B: Japa-nese quail. C: Budgerigar. D: Song sparrow. E: Anna’s hummingbird. The LMI lamina is the region of lower expression located between MD and MV. Scale bar = 0.5 mm.
Figure 27
Figure 27
Columns of EGR1 and DUSP1 activity-dependent gene expression in the songbird brain. A,B: Example of basal expression in an awake zebra finch, sitting still in the dark (Feenders et al., 2008; Horita et al., 2012). C,D: Example of hearing induced gene expression in a zebra finch that heard playbacks of three different conspecific songs, totaling 12 seconds in length, presented once every minute for 30 minutes (Feenders et al., 2008; Horita et al., 2012). E,F: Example of light induced gene expression in the visual pathway of the ventral pallium from a sitting still zebra finch stimulated with daylight for 1 hour after an overnight period of darkness (Mouritsen et al., 2005; Feenders et al., 2008). G,H: Example of induced gene expression in three columns: the visual pathway of the dorsal pallium, the adjacent anterior somatosensory pathway of the dorsal pallium, and a motor activated region of the ventral pallium surrounding the song nuclei in a zebra finch male that hopped around a cylindrical cage for ~30 minutes with lights on (Feenders et al., 2008; Horita et al., 2010). I,J: Example of hopping induced gene expression in the dorsal pallium somatosensory pathway and the ventral pallium motor regions surrounding the song nuclei in a deaf male zebra finch that hopped in a rotating wheel with lights off (Feenders et al., 2008; Horita et al., 2010). K,L: Example of dim-light, magnetic vision-induced gene expression in a light-dependent magnetic compass sensing column (Cluster N) of the dorsal pallium found in night-migrating garden warblers (Mouritsen et al., 2005). M,N: Example of hopping induced gene expression in a similar treated animal, but in a more medial part of the dorsal pallial somatosensory pathway (Horita et al., 2010). O,P: Example of singing induced gene expression in song nuclei of a male zebra finch that sang for 30 minutes and made some hopping movements in between singing bouts (Horita et al., 2012). Q: Example of a column of activation in N and MV of unknown function located between the known visual and somatosensory pathways of the ventral pallium, in a zebra finch that sat still perched in the dark for 30 minutes while awake. Scale bar = 1 mm.
Figure 28
Figure 28
EGR1 and singing. A,B: Medial and lateral sections from a quiet control, sitting still animal showing basal EGR1 expression. C,D: Medial and lateral sections from a singing animal (for ~30 minutes), perched, without much hopping, showing the highest levels of singing-driven increased gene expression in all seven song nuclei (lines), and hearing-driven increased expression in the auditory pathway (NCM, L1, L3, CM, CSt) from hearing itself sing. Images are from x-ray film exposure. Scale bar = 1 mm.
Figure 29
Figure 29
C-FOS and singing. A,B: Medial and lateral sections from a quiet control animal showing basal C-FOS expression, including slightly higher levels in the MD and MV near the LMI lamina. C,D: Medial and lateral sections from a singing animal showing the highest levels of singing-driven increased gene expression in all seven song nuclei and hearing-driven increased expression in the auditory pathway from hearing itself sing. Images are from x-ray films of sections adjacent to those shown in Fig. 28. Scale bar = 1 mm.
Figure 30
Figure 30
C-JUN and singing. A,B: Medial and lateral sections from a quiet control animal showing basal C-JUN expression, which is in the nidopallium, hyperpallium, and arcopallium. C,D: Medial and lateral sections from a singing animal showing the highest levels of singing-driven increased gene expression in the nidopallial, arcopallial, and striatal song nuclei. Images are from x-ray films of sections adjacent to those shown in Fig. 28. Scale bar = 1 mm.
Figure 31
Figure 31
ARC and singing. A,B: Medial and lateral sections from a quiet control animal showing basal ARC expression, which includes a gradient of high expression from the edges of the MD and MV to lower expression near the LMI lamina. C,D: Medial and lateral sections from a singing animal showing the highest levels of singing-driven increased increased gene expression in all seven song nuclei and hearing-driven increased expression the auditory pathway from hearing itself sing. Images are from x-ray films of sections adjacent to those shown in Fig. 28. Scale bar = 1 mm.
Figure 32
Figure 32
BDNF and singing. A: Lateral section from a quiet control animal showing basal BDNF expression in pallial regions, and even lower expression in song nuclei. B: Lateral section of a singing animal, showing the highest levels of singing-driven increased gene expression in pallial song nuclei HVC and LMAN, and a low level increase in RA. Images are from emulsion-dipped slides of sections adjacent to those shown in Fig. 28. Scale bar = 1 mm.
Figure 33
Figure 33
DUSP1 and singing. A,B: Medial and lateral sections of a quiet control animal showing basal DUSP1 expression, including in L2 in quiet controls after waking up and hearing ambient sounds. C,D: Medial and lateral sections of a singing animal showing the highest levels of increased gene expression in the nidopallial, arcopallial, and striatal song nuclei. This is specialized singing regulated expression, as DUSP1 is not induced by stimuli or behaviors in telencephalic areas outside of IH and IN except in song nuclei (Horita et al., 2012). Images are from emulsion-dipped slides, of sections adjacent to those shown in Fig. 28. Scale bar = 1 mm.
Figure 34
Figure 34
Substance P protein expression profiles reinterpreted in the context of the view presented in this study. A,B: Anterior and posterior coronal sections of substance P protein expression in pigeon brain. Higher substance P label is restricted to the pallidum, striatum, and a region of the hippocampus. A higher magnification image from panel B (boxed region) was used as evidence for the 2004–2005 nomenclature revisions (Reiner et al., 2004b) to the claim that the classically named hyperstriatum dorsale (HD; MD in these pictures) was similar to the hyperpallium (H in these pictures), but not to the revised mesopallium (MV in these pictures). The more expanded images shown do not support those similarities. C,D: Anterior and posterior coronal sections of substance P protein expression in zebra finch brain. The pattern is very similar to pigeon. Serial substance P sections are shown in the Supporting database folder. Images are courtesy of Dr. Toru Shimizu, with interpretations specific to this study. Scale bar = 0.5 mm.
Figure 35
Figure 35
General model of avian brain organization according to this study and the literature. A: Drawing in sagittal view with subdivision shapes based on songbirds (i.e., fig. 1 of Jarvis et al., 2005) and with arrows showing known connectivity. B: Same drawing as in (A) with outlines of different brain systems that show columnar activation of IEGs. C: Drawing in coronal view with subdivision shapes based on ring dove and pigeon (including fig. 1 of Reiner et al., 2004a). D: Drawing in horizontal view with subdivision shapes based on songbirds. Color-coding is according to shared gene expression profiles quantified in Fig. 3A. Regions of continuity are also shown. Solid white lines are lamina that separate subdivisions. Dashed lines divide regions within a subdivision, whether a lamina is present or not. Although all subdivisions are not present in sagittal and especially coronal planes, we projected them onto one plane to allow comparisons.

Comment in

References

    1. Abellan A, Medina L. Subdivisions and derivatives of the chicken subpallium based on expression of LIM and other regulatory genes and markers of neuron sub-populations during development. J Comp Neurol. 2009;515:465–501. - PubMed
    1. Abellan A, Menuet A, Dehay C, Medina L, Retaux S. Differential expression of LIM-homeodomain factors in Cajal-Retzius cells of primates, rodents, and birds. Cereb Cortex. 2009;20:1788–1798. - PubMed
    1. Ariens Kappers CU, Huber CG, Crosby EC. Comparative Anatomy of the Nervous System of Vertebrates, Including Man. New York: Hafner; 1936. Reprinted 1960.
    1. Aboitiz F. Genetic and developmental homology in amniote brains. Toward conciliating radical views of brain evolution. Brain Res Bull. 2011;84:125–136. - PubMed
    1. Atoji Y, Karim MR. Expression of the neocortical marker, RORβ, in the entopallium and field L2 of adult chicken. Neurosci Lett. 2012;521:119–124. - PubMed

Publication types

Substances